
This one pushed me to my limit. Two weeks ago, I did the version of this where I did 6′ at 5KP and 9′ at MP, and it was a pretty easy ride. Swapping those two was brutal.
It’s a bit of a bummer, because I have rowed longer than this at a much faster pace then the 5KP, but it is what it is, and I can work with it.
The first rep was pretty manageable, but I definitely felt like I was working hard. This step down format is a pretty fiendish way to do an interval. I was struggling to get to the end of the 9 minute block, and my central governor really wanted me to stop at that point. Instead, you slow down. But you don’t slow down enough to feel much better. My heart rate slowly drifted down and my RPE was amazingly high for a 2:03 pace.
I reprogrammed my power zones in rowsandall to reflect my marathon target paces.


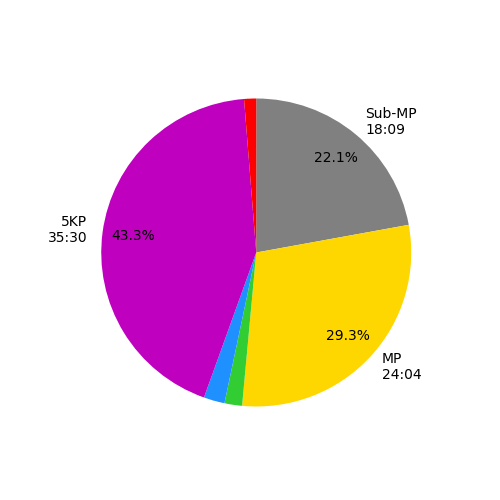
So for this workout, the goal was 36 minutes at 5KP and 24 minutes at MP. The power pie chart shows exactly that break down. So it will be a useful way to track this type of workout on the erg, and even when I am on the water.

Pics of the PM. I set it up as a variable interval session so I could grab the warmup along with the main set in one set of data.


Workout Summary - media/20170130-1315200o.csv
--|Total|-Total-|--Avg--|-Avg-|Avg-|-Avg-|-Max-|-Avg
--|Dist-|-Time--|-Pace--|-Pwr-|SPM-|-HR--|-HR--|-DPS
--|19032|82:01.0|02:09.3|187.5|23.0|159.5|179.0|10.1
W-|16257|64:00.0|01:58.1|213.6|23.3|165.0|179.0|11.0
R-|02782|18:01.0|03:14.4|064.8|21.5|134.5|179.0|08.8
Workout Details
#-|SDist|-Split-|-SPace-|-Pwr-|SPM-|AvgHR|MaxHR|DPS-
00|01018|04:00.0|01:57.9|212.8|22.2|132.4|148.0|11.4
01|02351|09:00.0|01:54.8|231.5|24.1|157.9|166.0|10.8
02|01464|06:00.0|02:02.9|188.7|20.8|160.5|166.0|11.7
03|02355|09:00.0|01:54.6|232.9|24.6|164.7|175.0|10.6
04|01464|06:00.0|02:03.0|188.3|21.1|170.2|175.0|11.6
05|02347|09:00.0|01:55.0|230.0|24.7|169.0|177.0|10.6
06|01462|06:00.0|02:03.1|187.7|21.9|173.7|178.0|11.1
07|02335|09:00.0|01:55.6|228.5|24.9|170.1|179.0|10.4
08|01460|06:00.0|02:03.3|187.1|22.0|174.5|179.0|11.1
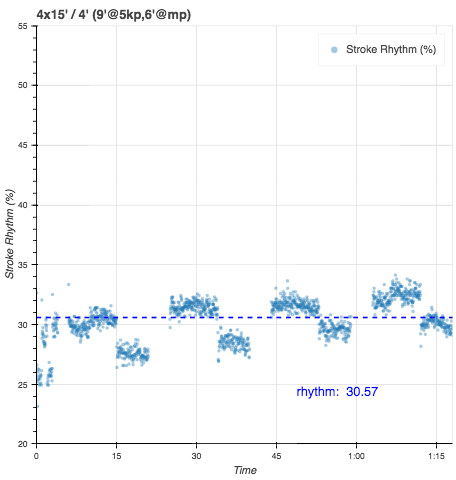
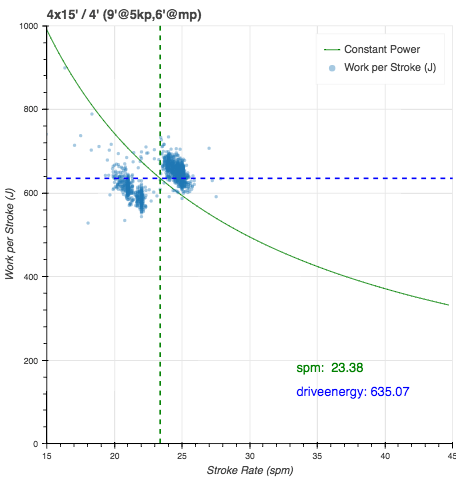
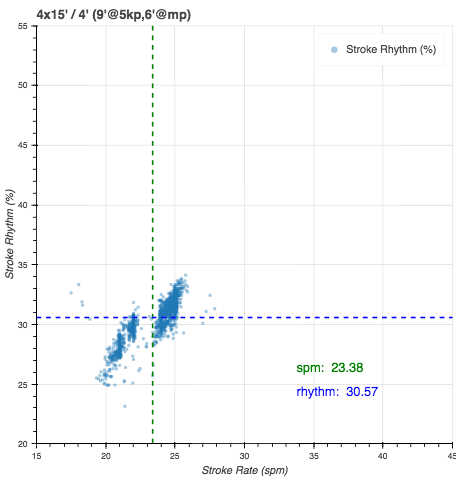
I did a bunch of flex plots. Drive length is good and consistent across rates and as I geot more tired. It’s cool to see the effect of fatigue on stroke rhythm. You can see my trading off higher rate to try to hold on to the power and the force I could generate declined. The work per stroke versus stroke rate shows an increase with stroke rate. I think that is mainly because the lower power stuff was tacked onto the end of the higher power stuff, so I was really spent and barely hanging on during those sections. I usually see a flatter work per stroke than that.


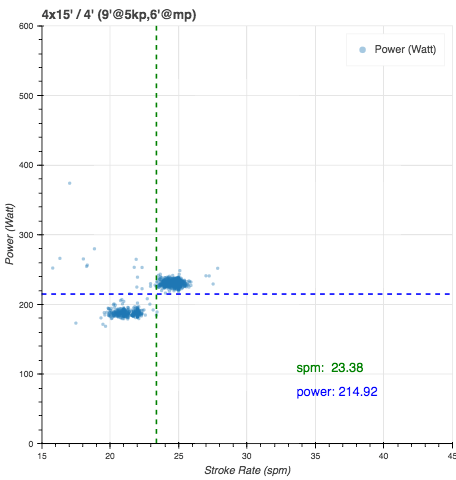
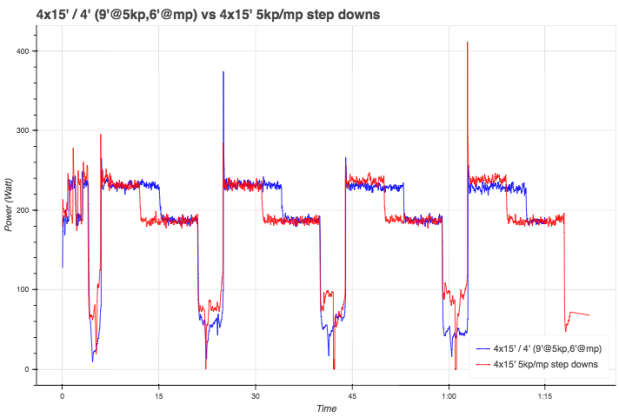
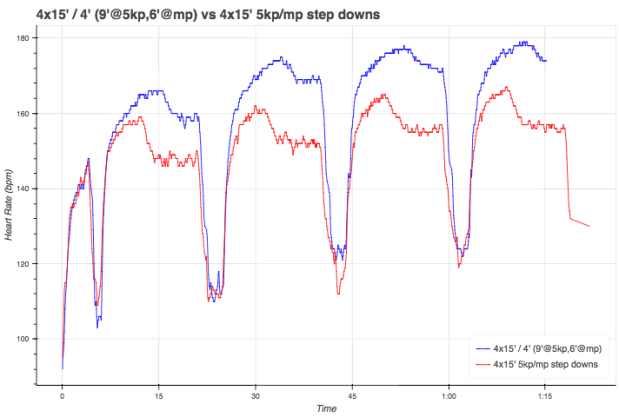
Last week I did a version of this workout but with 6′ at 5KP and 9′ at MP. I was interested to compare them. The first plot is power and you can see that I was hitting the same target. You can see that I was rating a touch higher, and I think that’s a good thing. Finally in the HR comparison, you can see that I was struggling more with this workout more than the other one. My HR was higher at 6′ in interval #1 today than it was last time. I think accumulated fatigue and time of day are the main factors there.

Tomorrow:
| 3 x 30′ / 3′ | Pace: MP, 10KP, MP | HR cap: 90.0% (167) |

Nicely done. This session always scared the pants off me when it approached in my plans.
LikeLiked by 1 person
I was scared just from reading your posts about it.
LikeLiked by 1 person
Nice use of the analytics. This seems a very useful way to work with the rowsandall.com site.
I like the comparisons esp on heart rate and should use them more often myself.
LikeLike