June 3 – 8: Trying out Humon

Monday – June 3: Humon Threshold Test and a few intervals

I bought a new toy.  A Humon Hex.  A muscle oxygen sensor.  I straps to your thigh and shines a light into your quadriceps.  The color of the reflected light can be used to determine the amount of oxygen in your muscle.  It advertised the ability to help you monitor lactate threshold in real time and suggested that it could help optimize both steady state and interval training.

The app supports 3 exercise types; running, cycling and rowing.  It also supports 3 sessions types; steady state, intervals and a threshold test.  Sadly, a rowing threshold test is not yet supported, but I decided  to just try it in cycling mode to see what happened.

The app is pretty slick.  I ran it on iPhone, but you can also use it with Android.  It pairs with the Humon Hex sensor and optionally a BLE HR monitor.  I’ve had mixed results trying to get the HR monitor to pair with it, but the Humon Hex sensor has been absolutely reliable in making and keeping the connection to the phone.

If you pick a Threshold test, it tells you what power to row, and counts down to your next power level while showing your smO2 percentage on the screen.  The instructions are pretty simple.  Start at 30W, and increase by 30W every 3 minutes.  Stop when you can’t do it anymore.  The app then tells you what your lactate threshold power is.  (Aka your FTP).

I sat down and gave it a go.

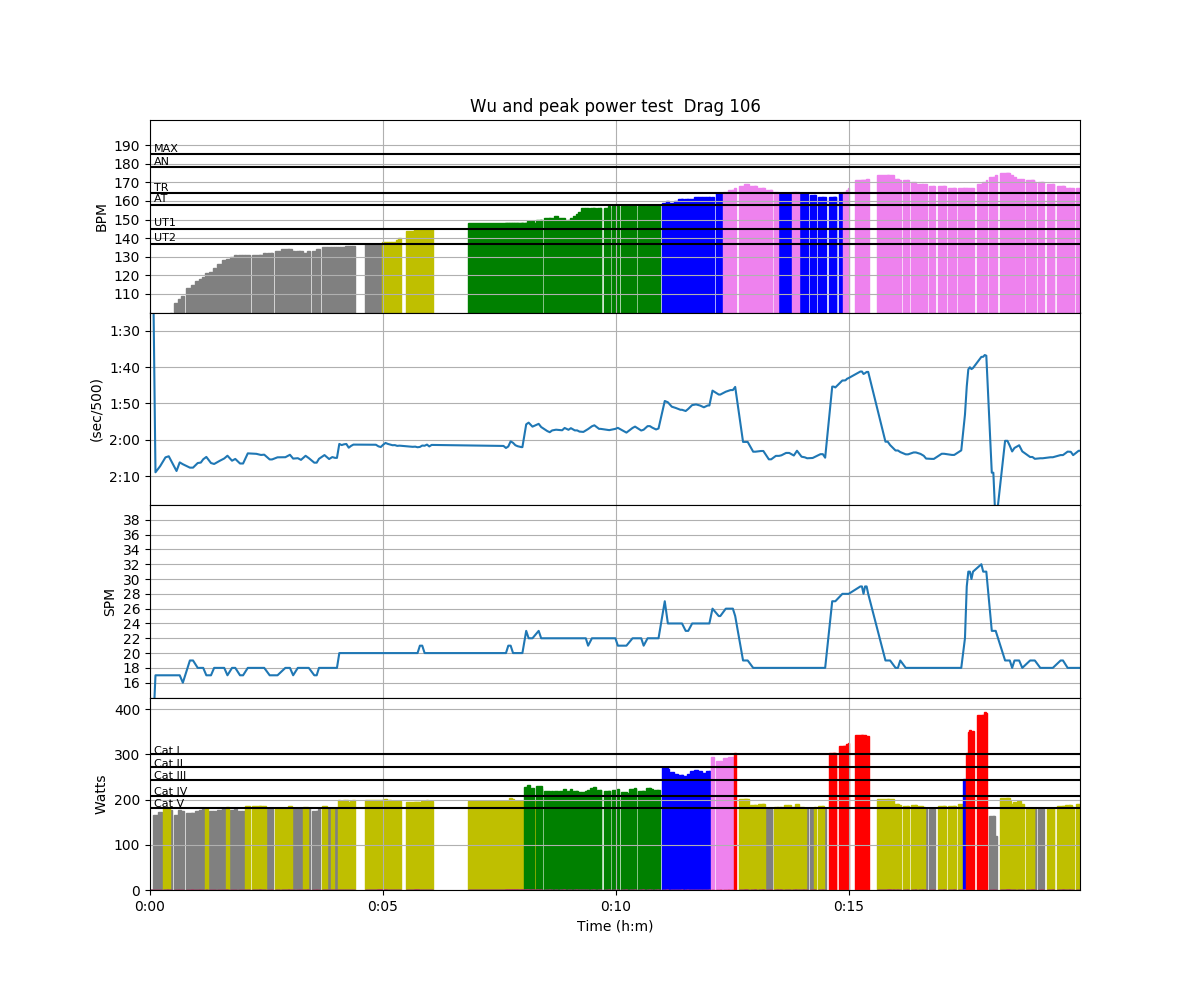
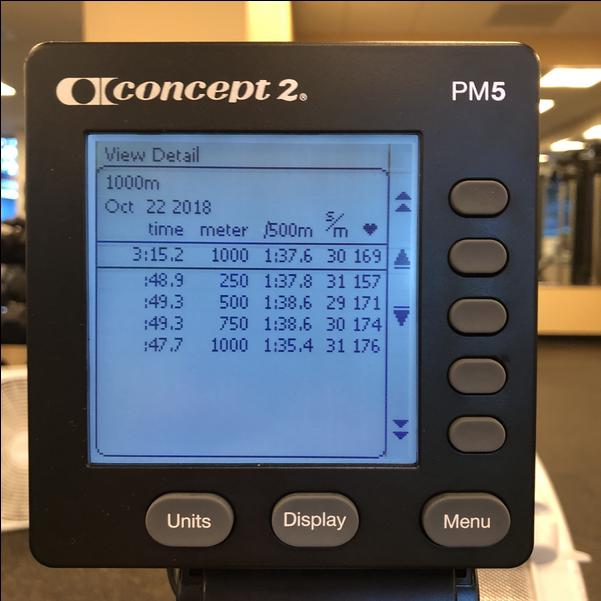
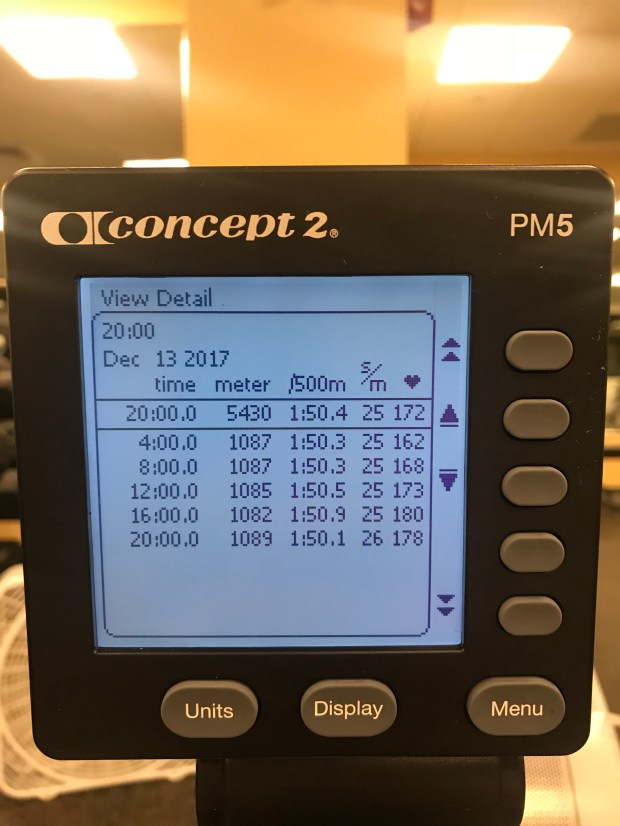
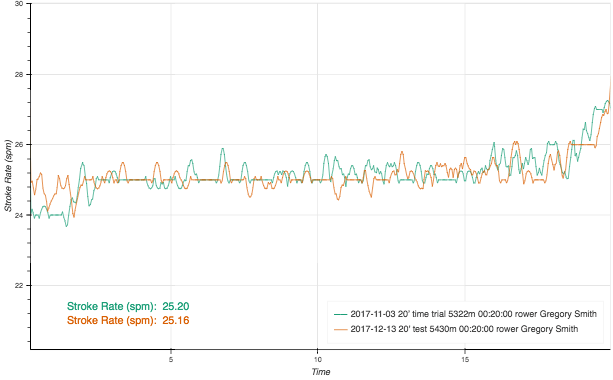
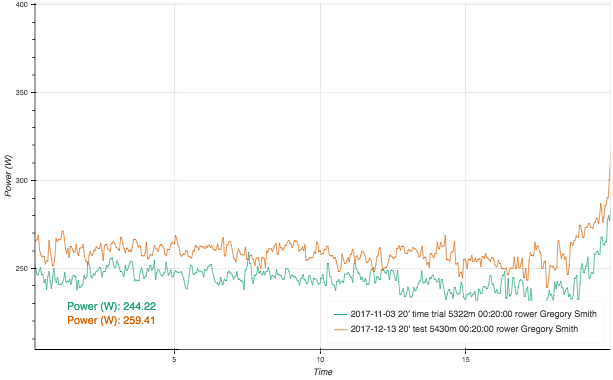
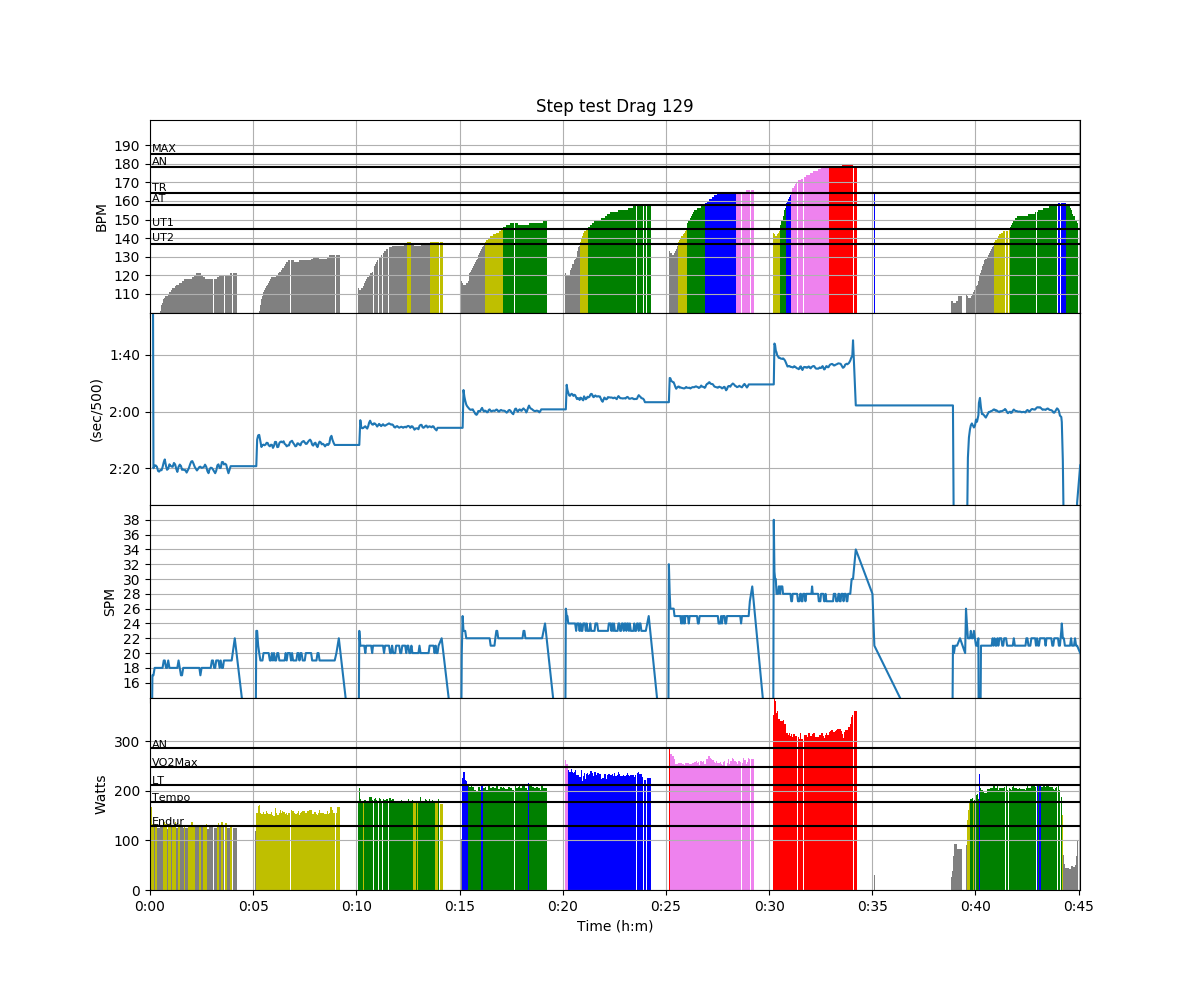
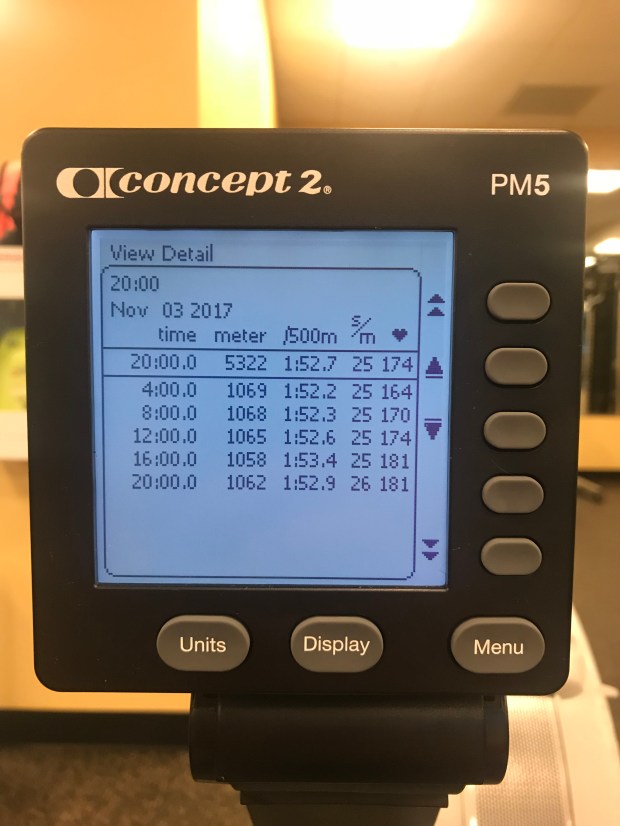
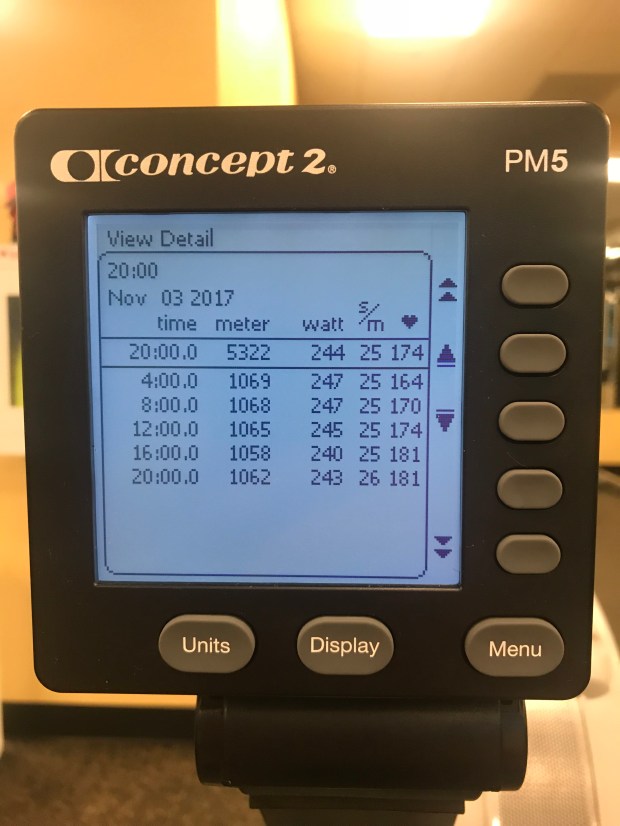
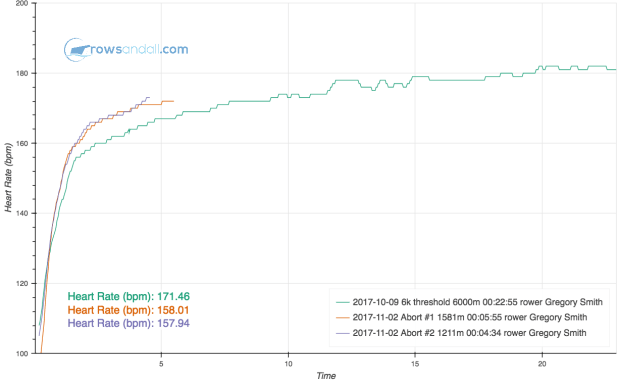
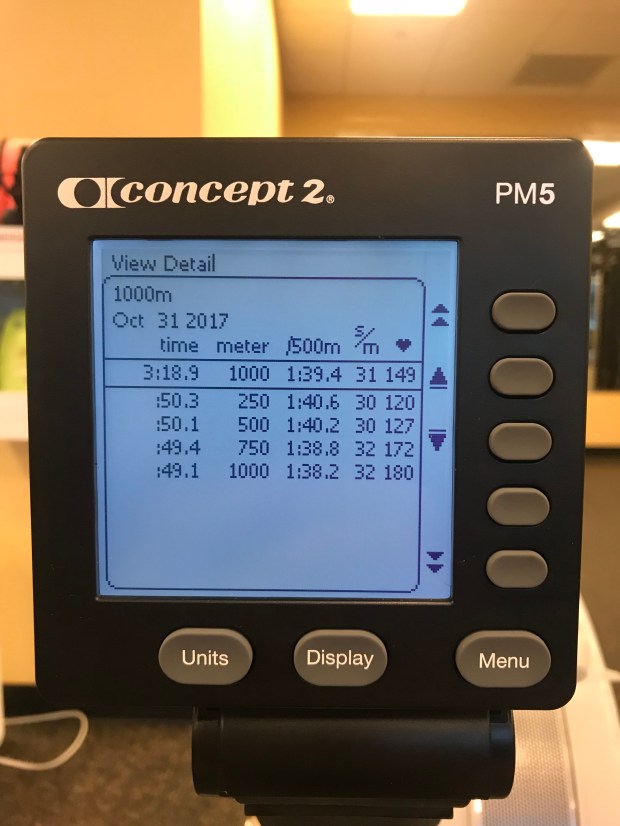
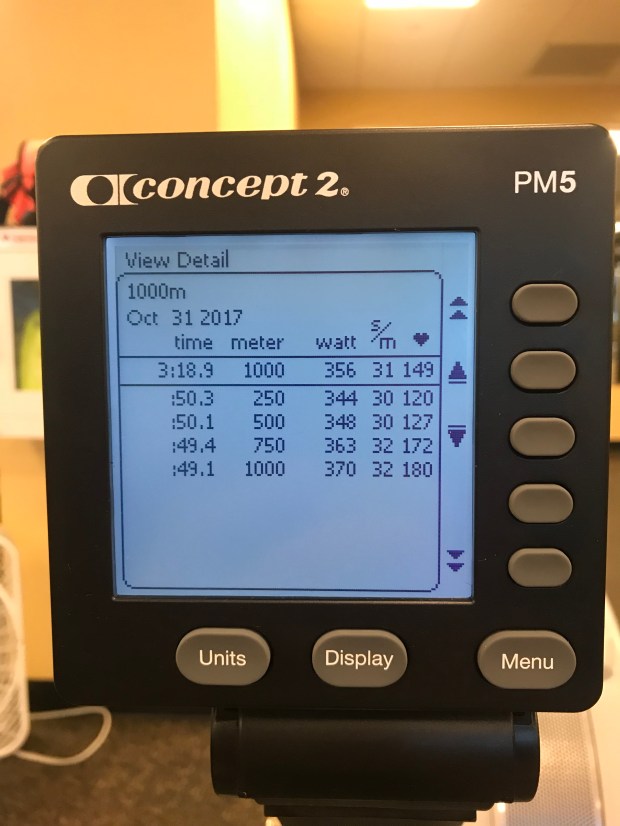
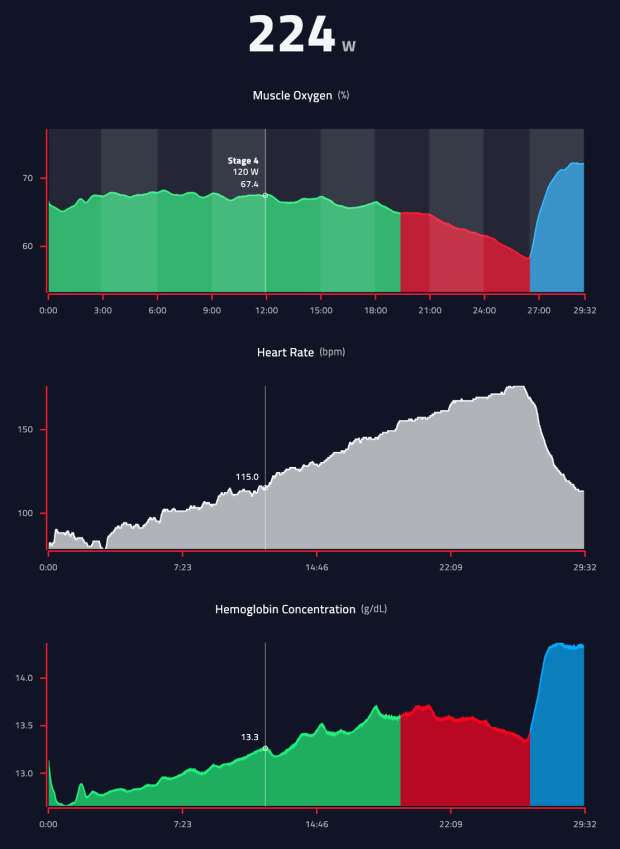
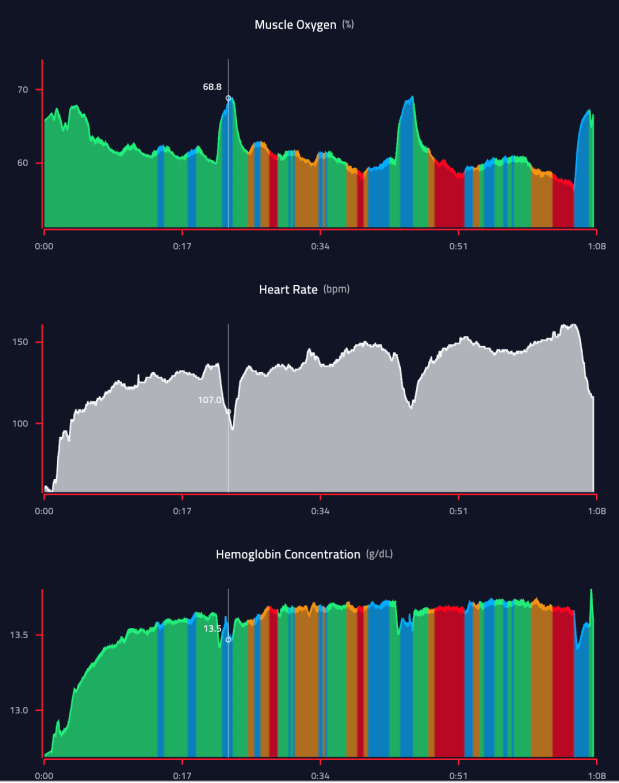
Here are the results from the online data site.

Screen Shot 2019-06-15 at 8.29.28 PM.png

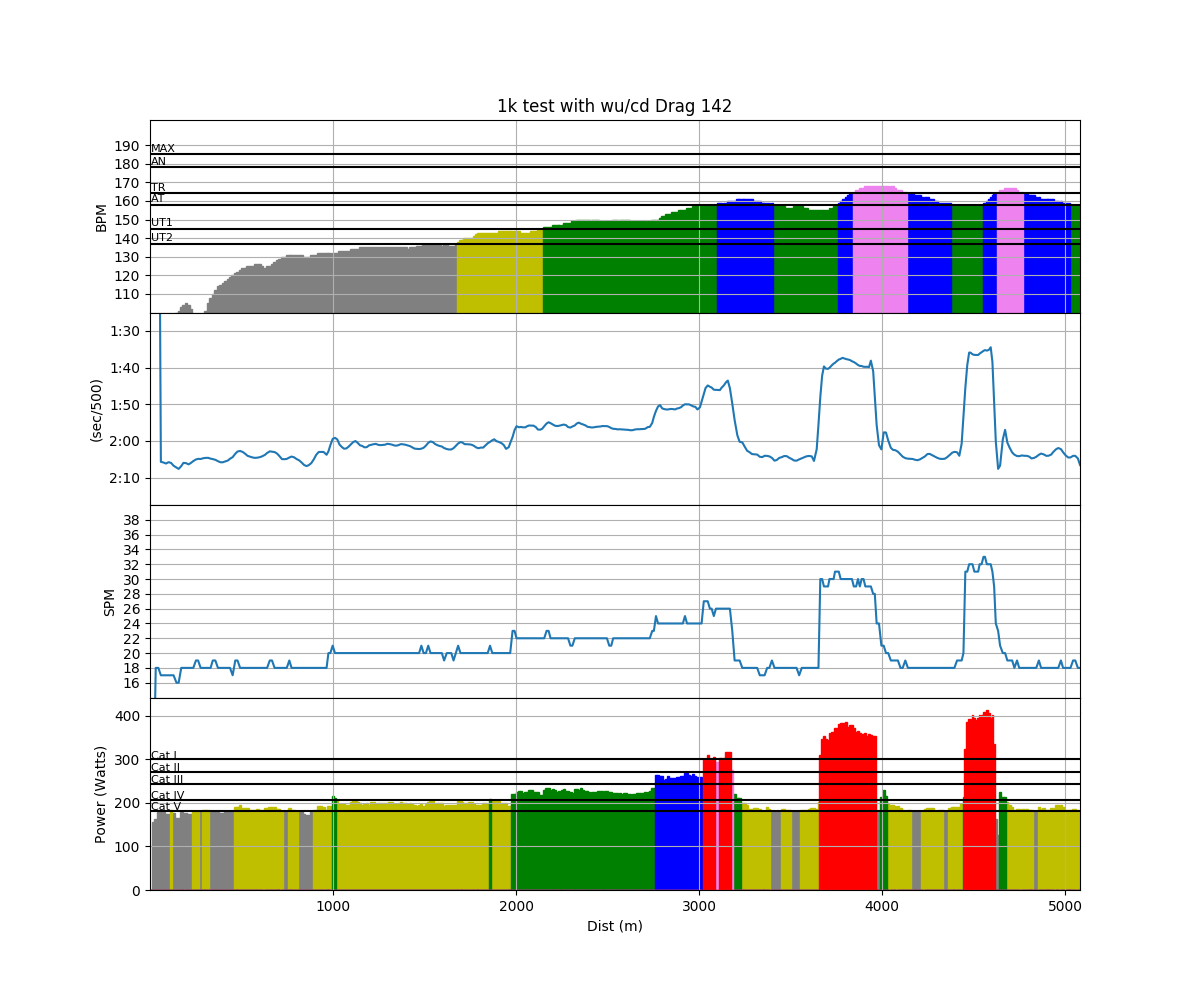
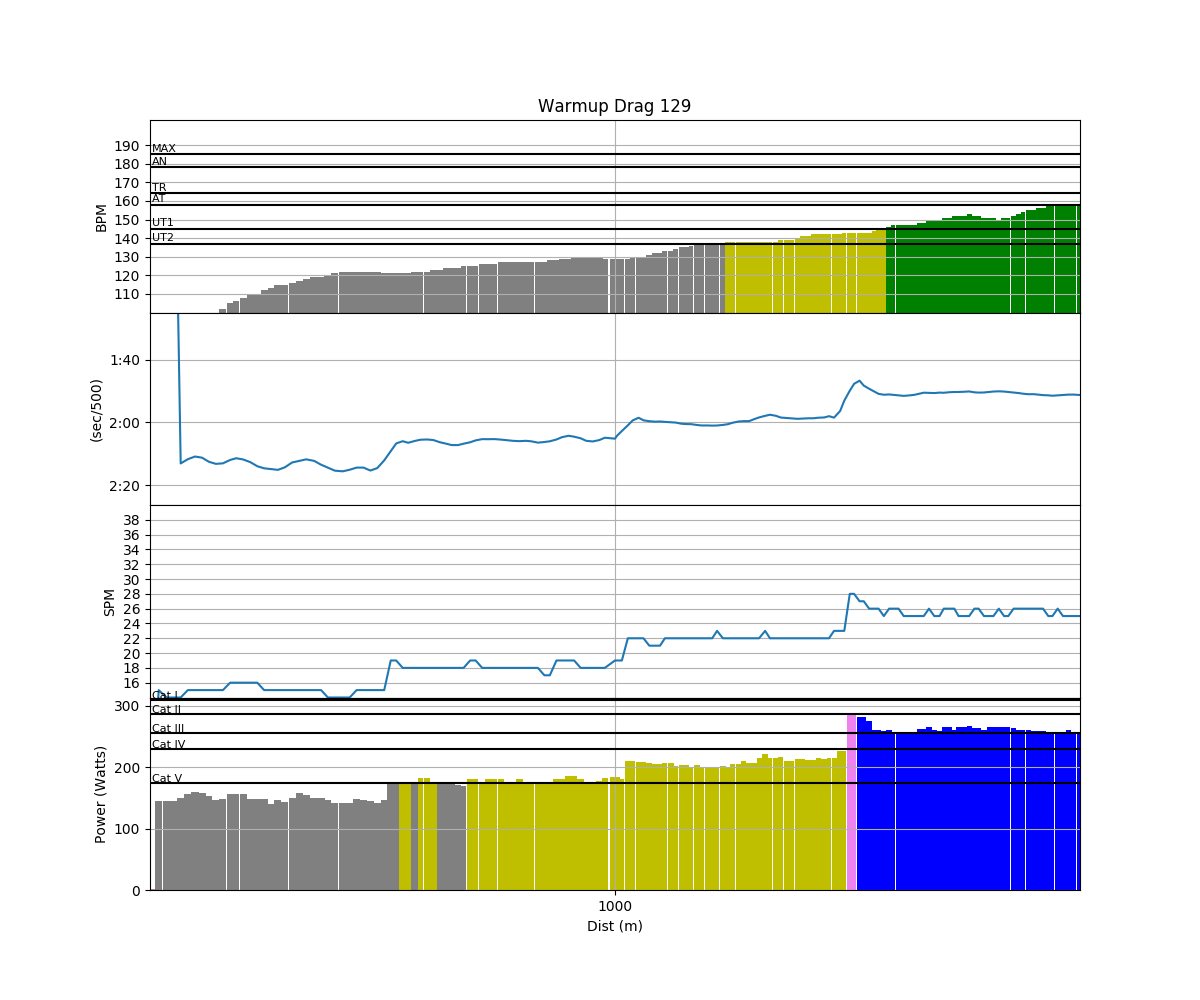
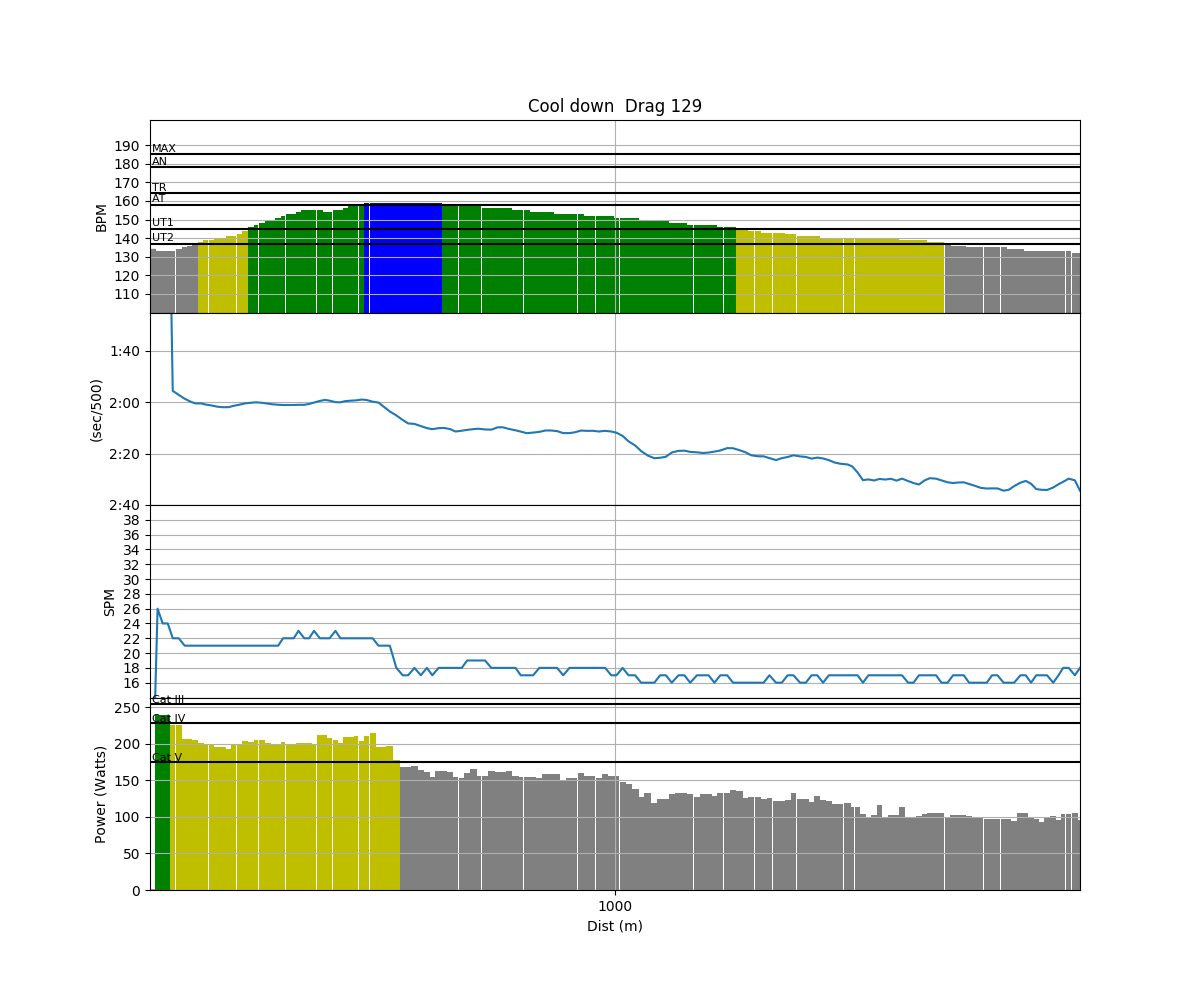
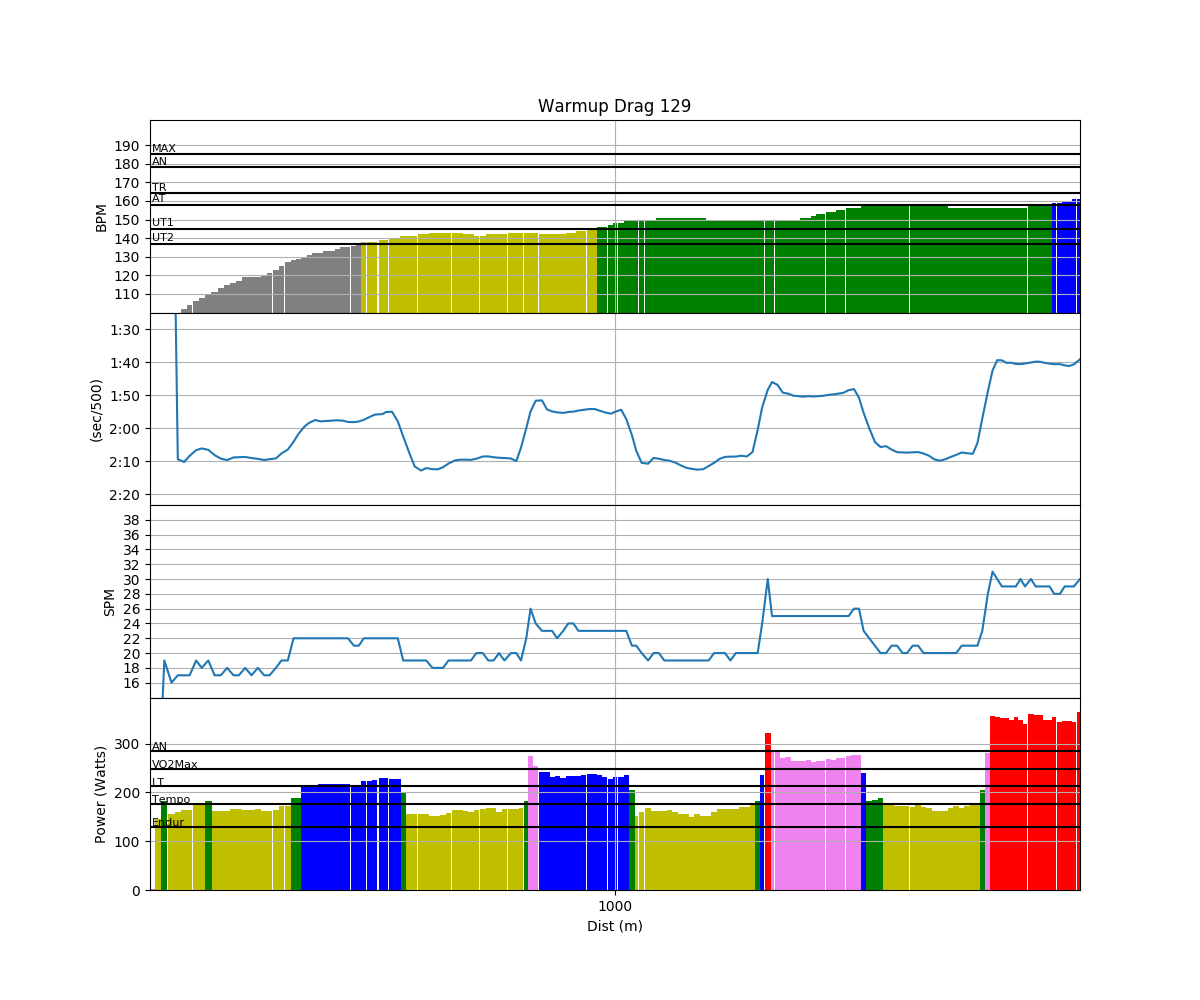
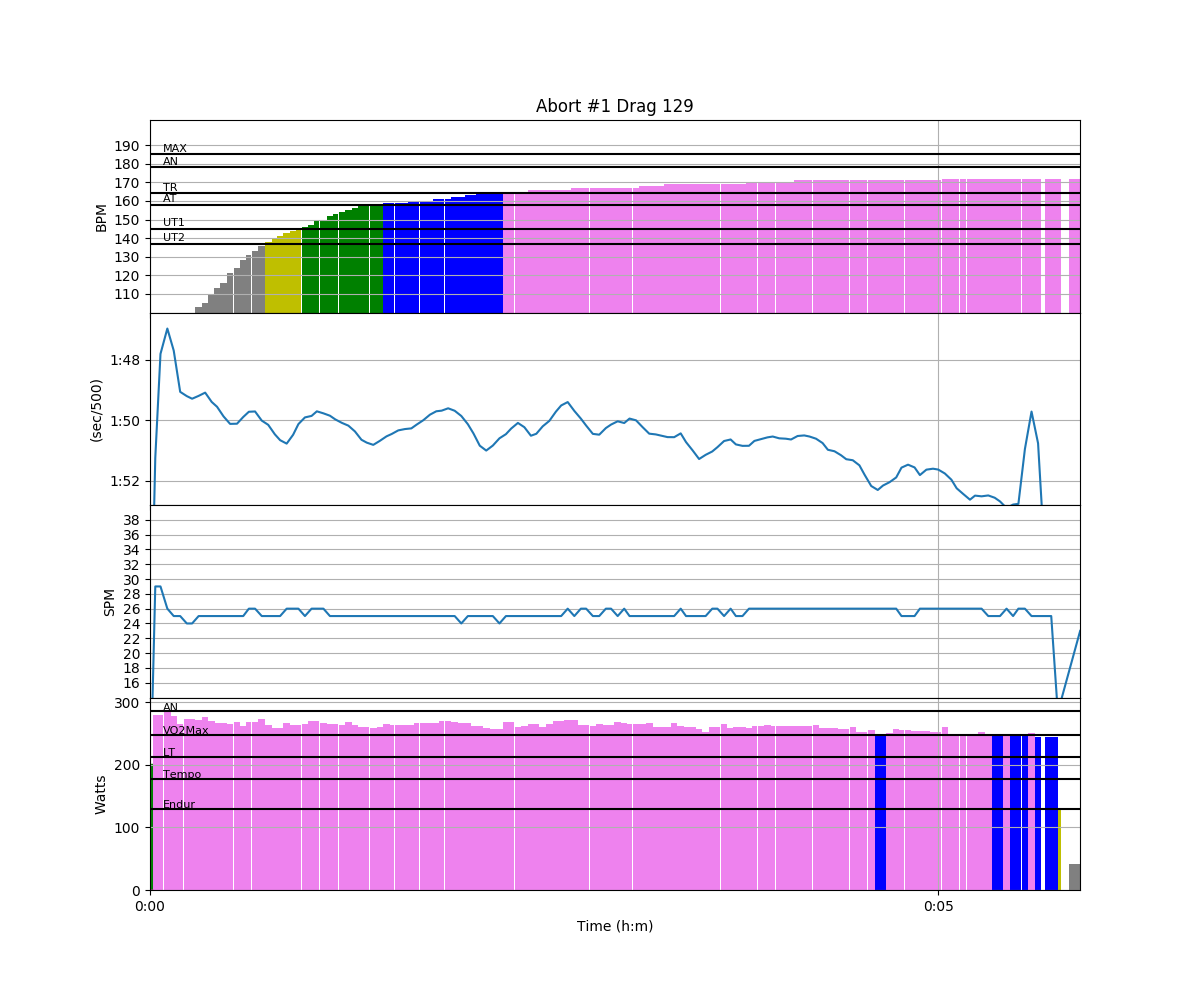
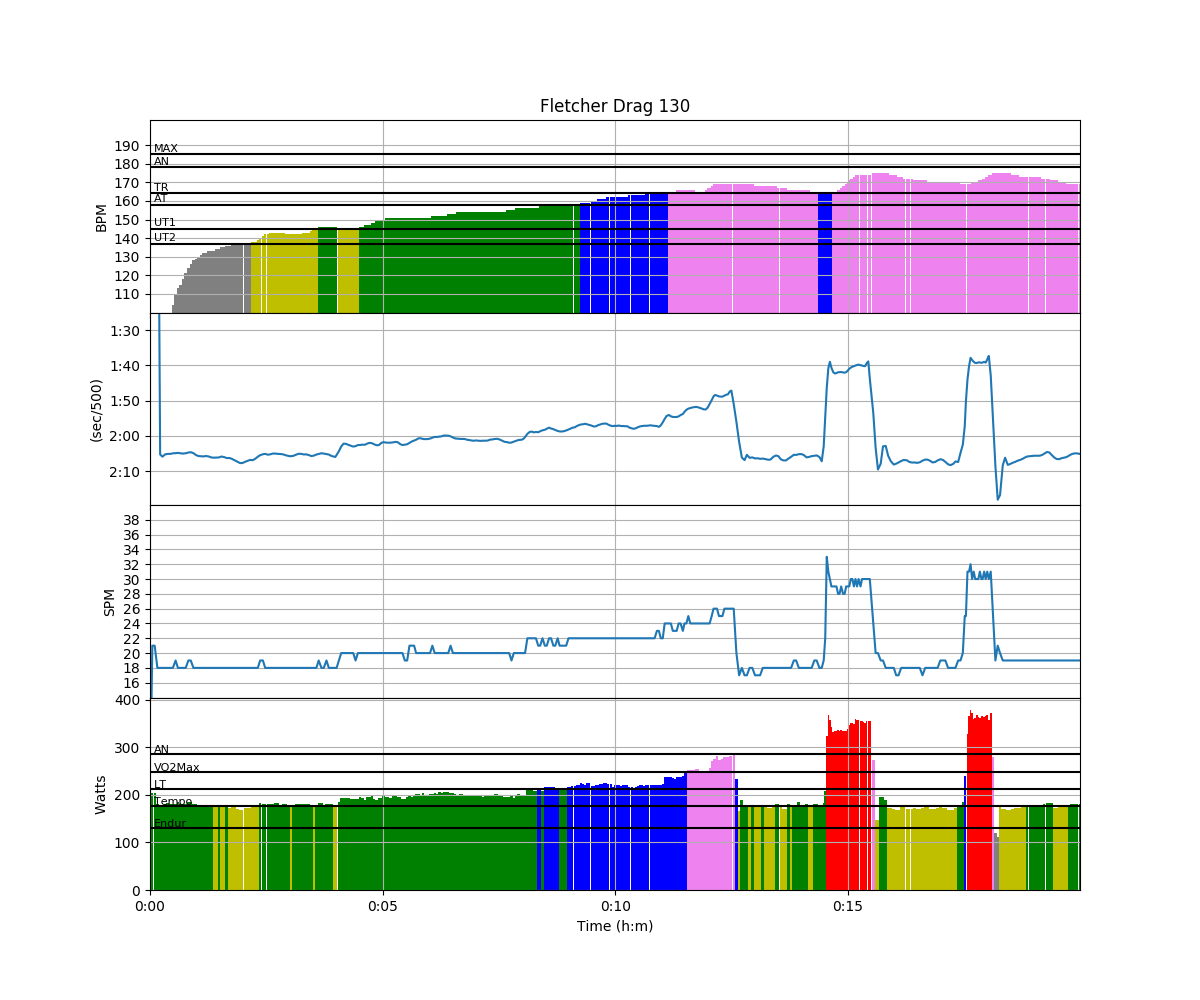
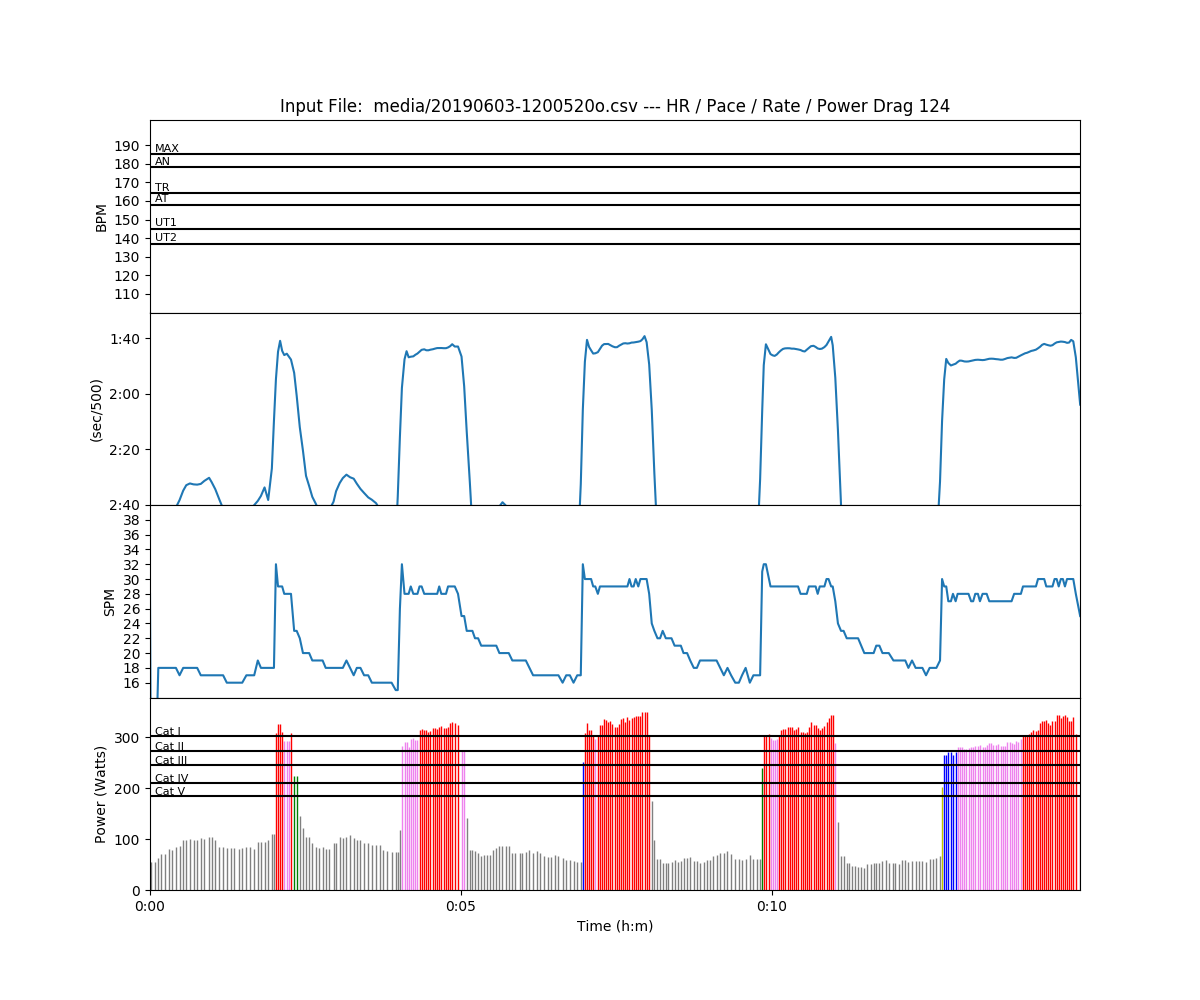
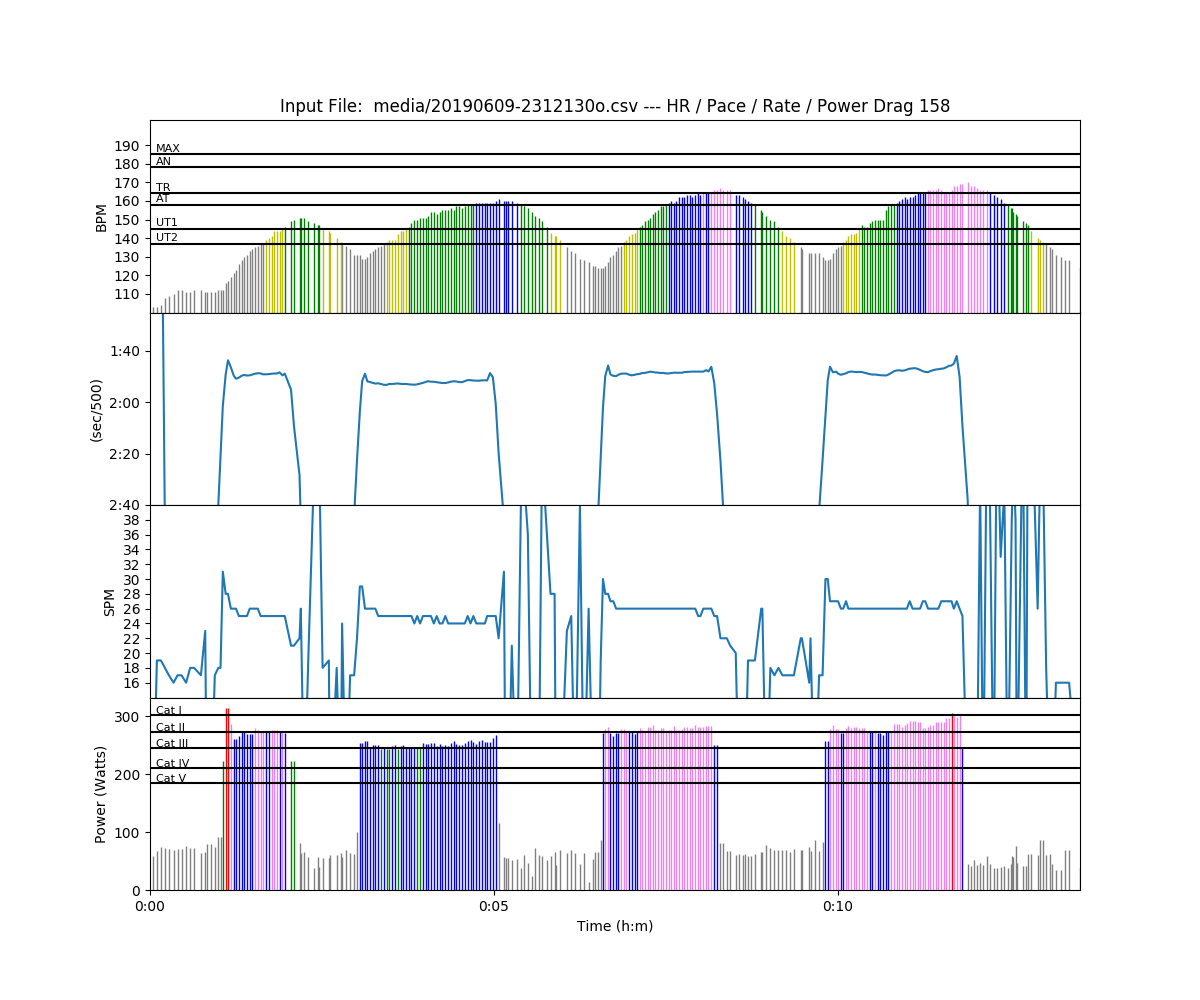
So, weird thing happened.  I was pushing through and I reach the 20 minute mark and go into the “red”.  I keep pushing, because that’s what they say I should do, and within a minute or so, the display goes green again.  That’s pretty weird.  It tells me I’m at “Steady State”, and I feel like I’m close to exploding.  Well, no algorithm is perfect right?  Maybe it’s the difference between rowing and cycling?  Here’s the painsled view of the same session. (I had the HR connected to Humon, not painsled for this session)

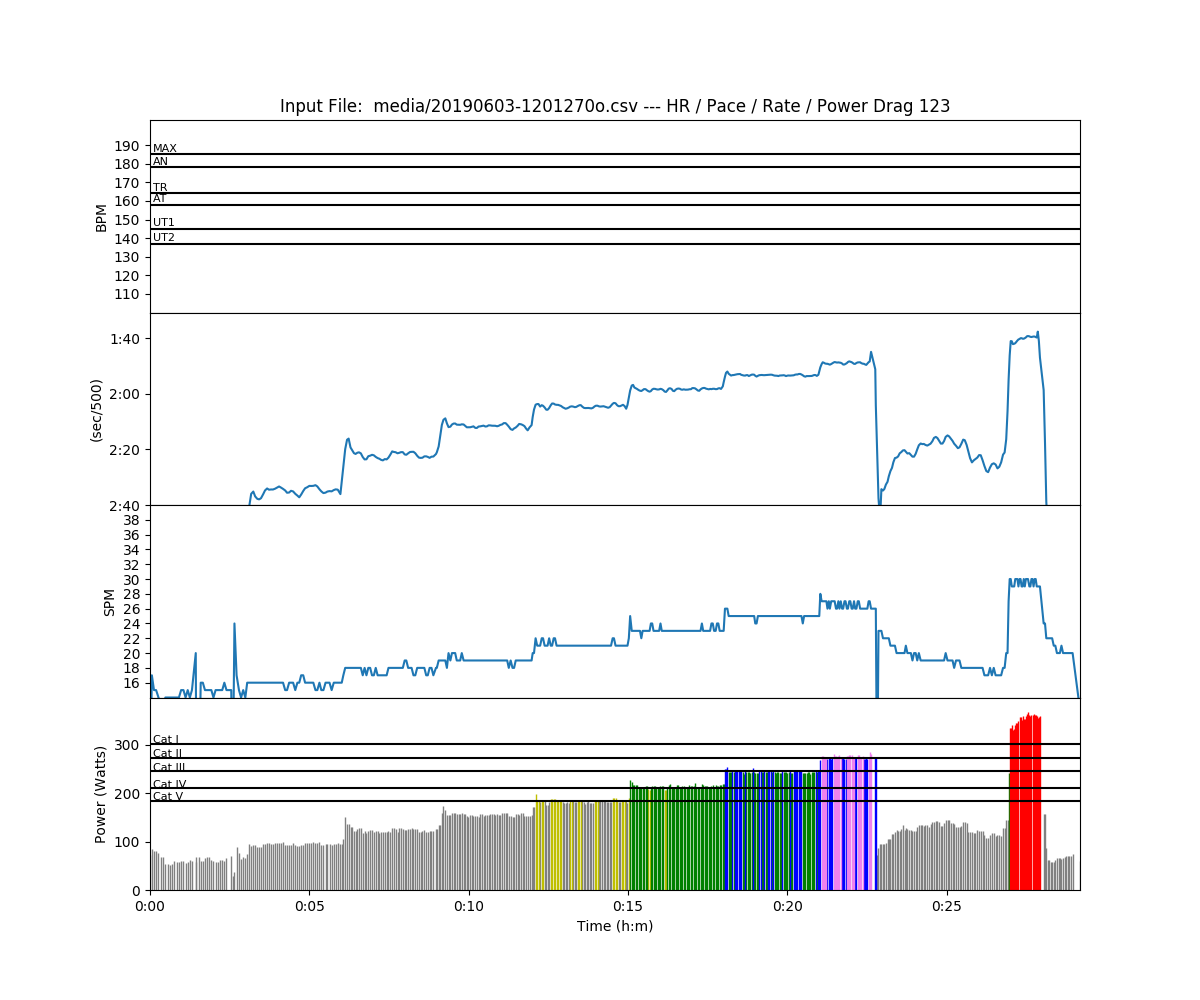
I must have done something wrong, because it didn’t give me an FTP value.

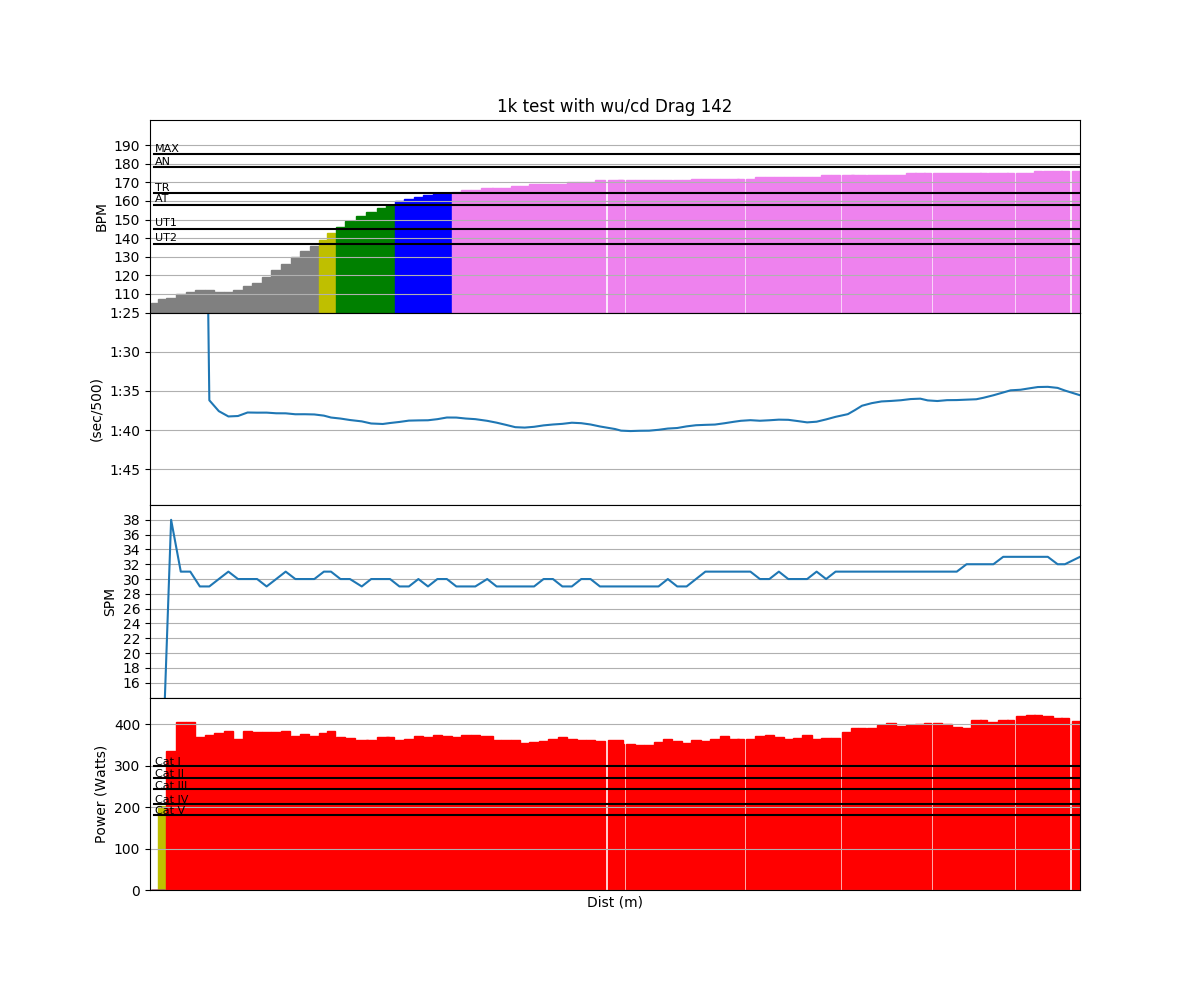
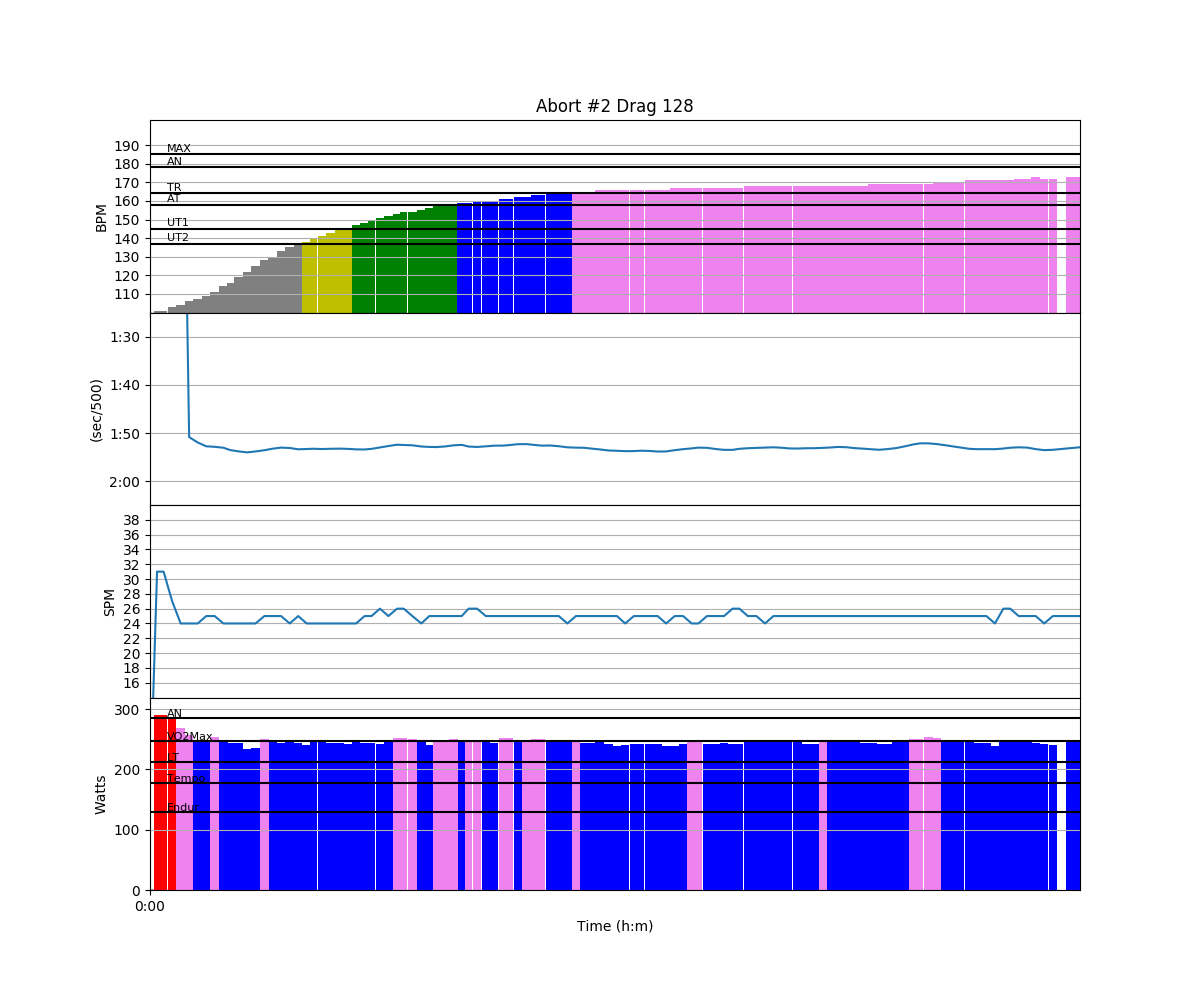
You can see I did a hard minute after I rested up to watch what would happen with the Humon.  This time it went red and stayed red for that.

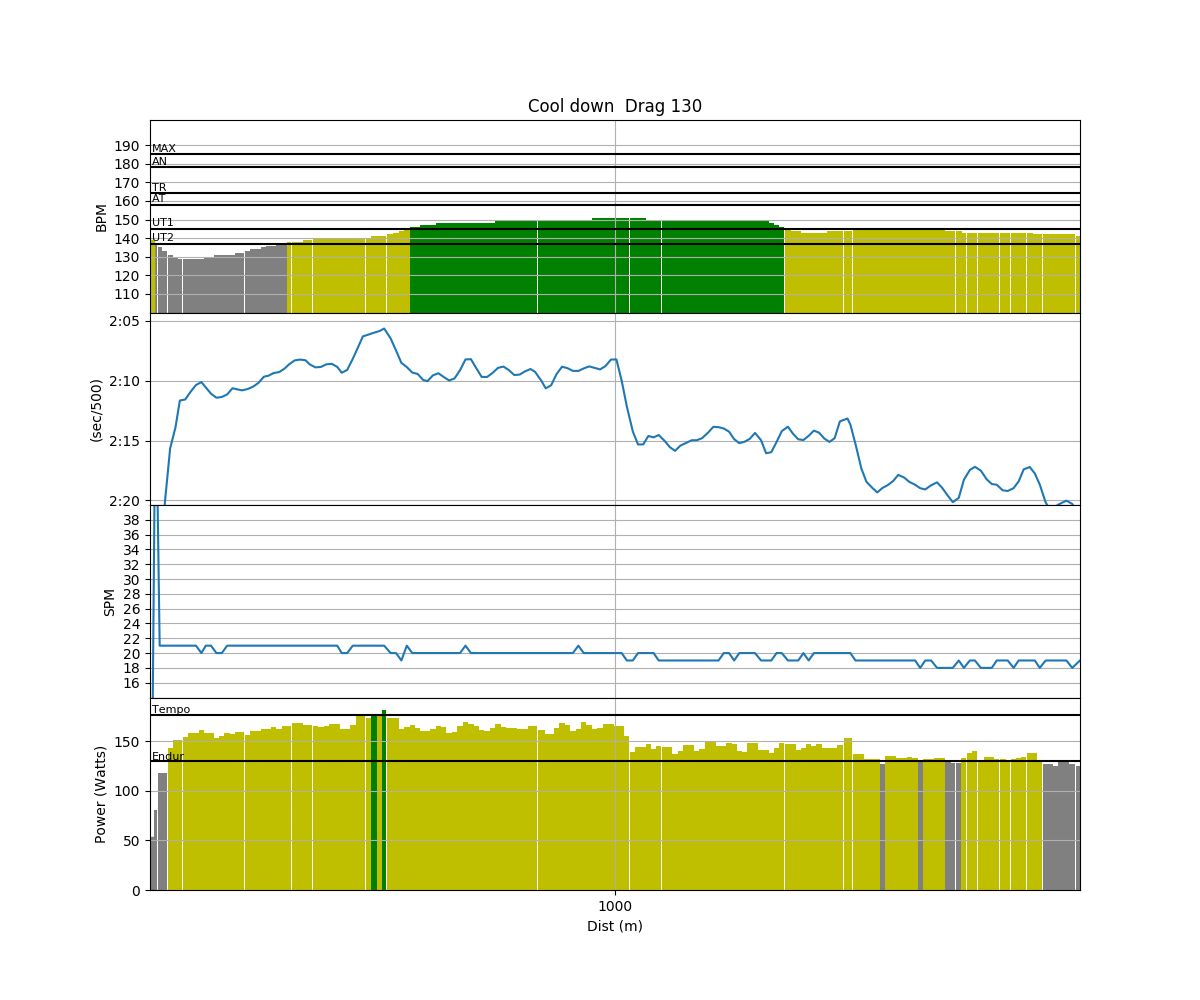
I still had some time and I wanted a bit more exercise, so I just put the rower on just row and set up the humon app to guide me through intervals.  The theory is that you go until you are in the red zone and the % plateaus.  Then you rest until the % goes back to green.

Screen Shot 2019-06-15 at 8.36.55 PM

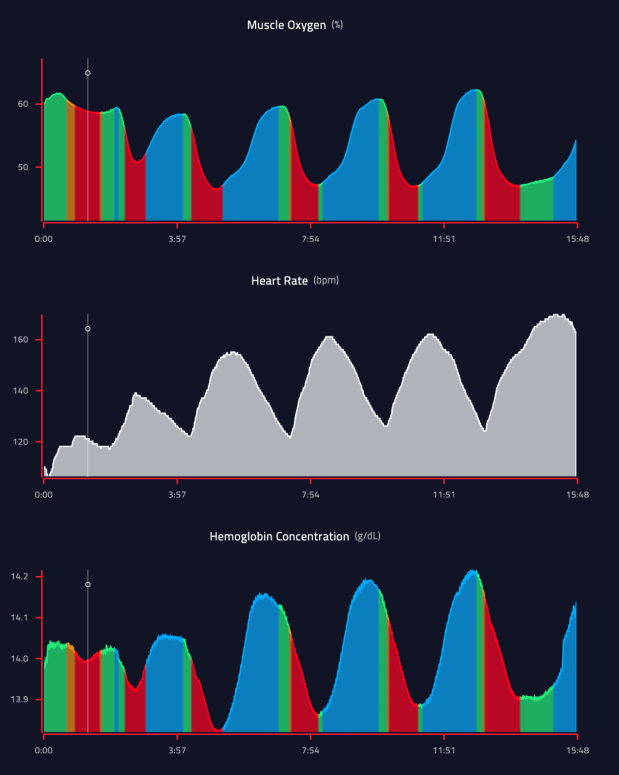
You can see in the last interval, where I dug pretty deep, that Humon flipped me back to green.  An interesting quirk.  I found this an interesting way to do intervals

Tuesday – June 4:  Another attempt at the threshold test

I violated a rule about testing.  Generally, you want to take an easy day between tests, but I didn’t think that I pushed all that hard in the prior day’s test and I really wanted to try it out again.

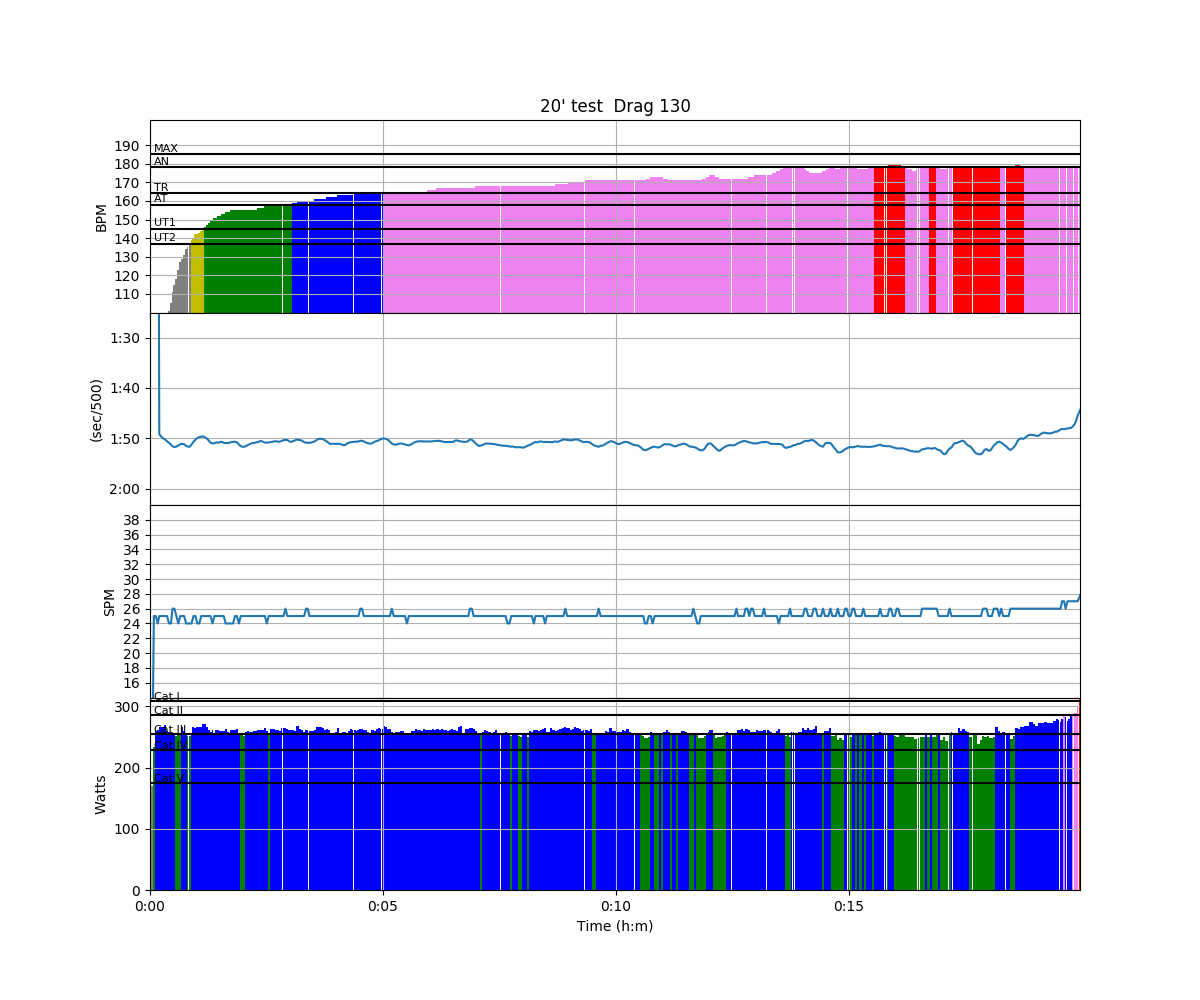
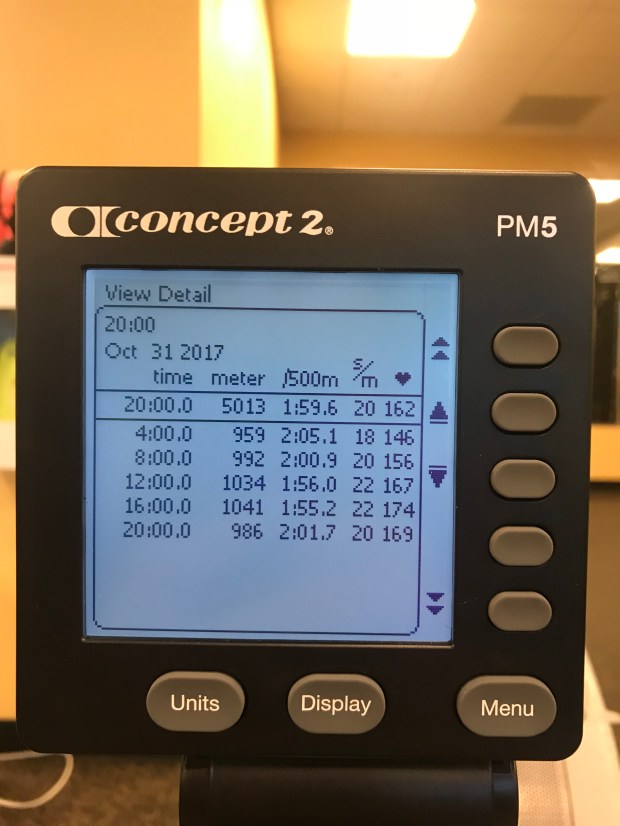
This time, I managed to get the app setup right and it actually told me what it thought my FTP was.

Screen Shot 2019-06-15 at 8.41.30 PM

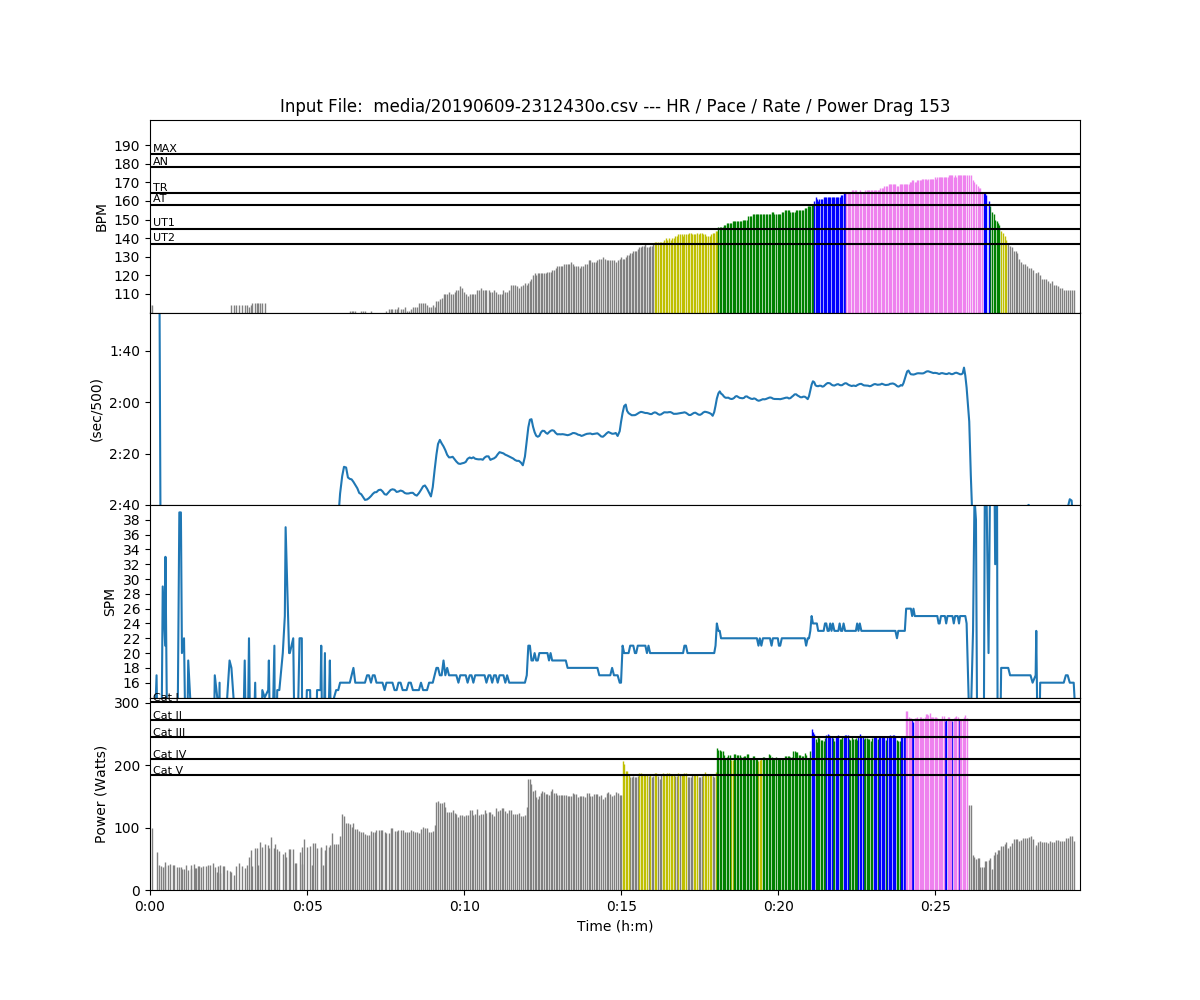
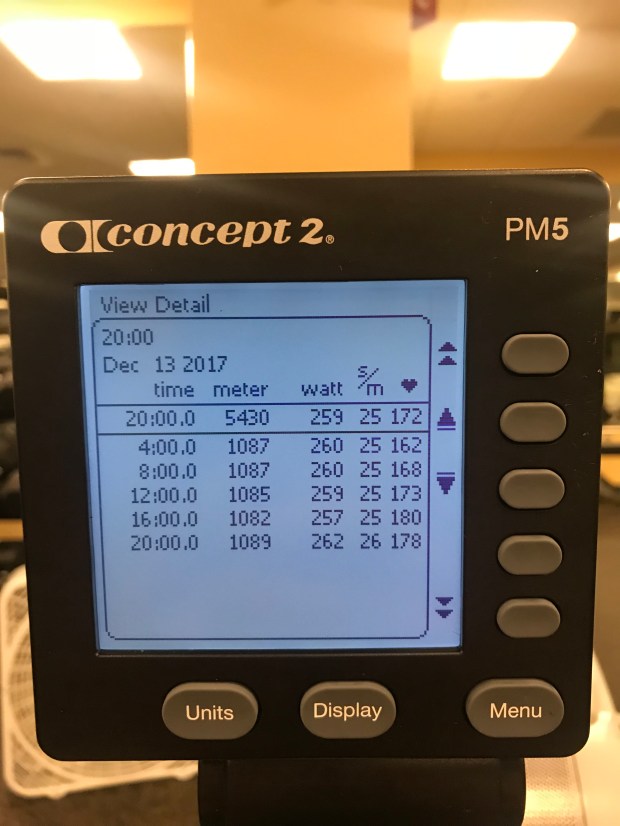
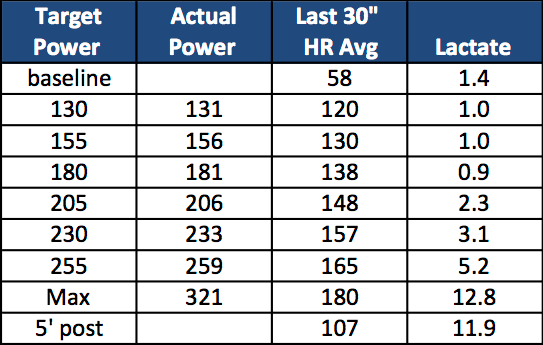
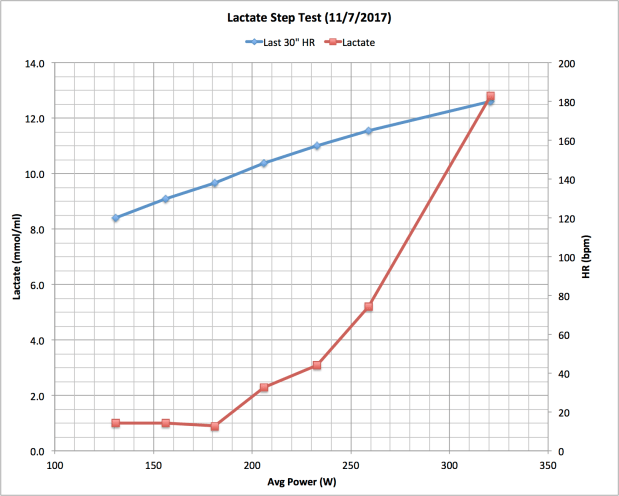
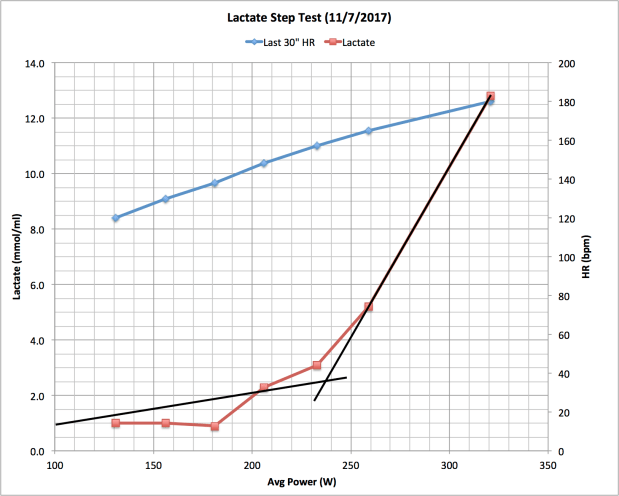
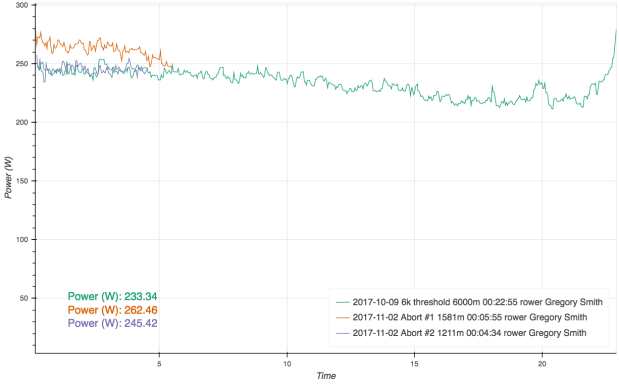
I flaked out at about the same power as Monday.  The test estimated my FTP at 224W.  This actually seems pretty sensible.  In October of 2017, I measured it with a 20′ test at 244W and with a lactate step test at 238W.  I was in better shape then.  I also think I pushed the test a bit harder then.

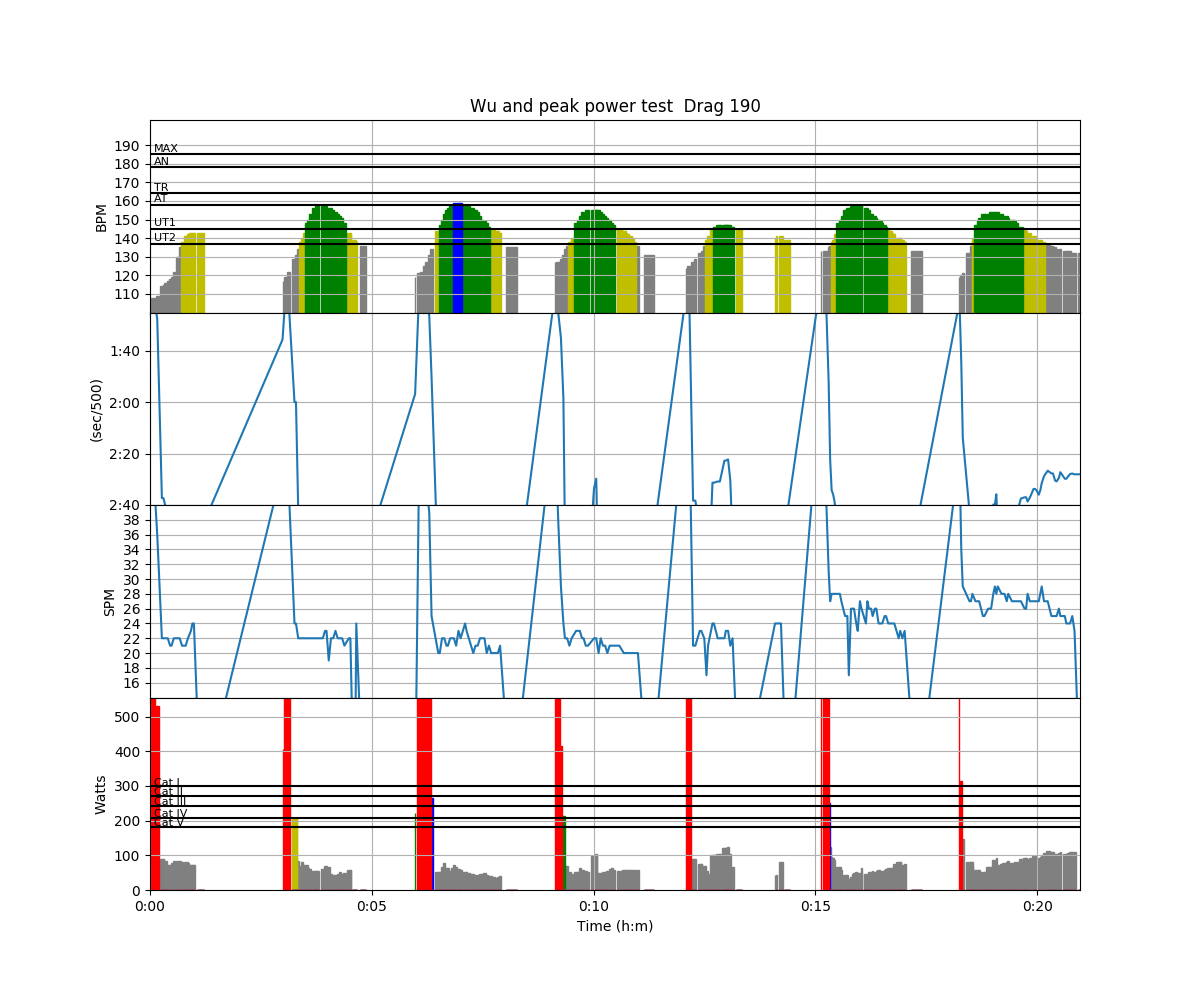
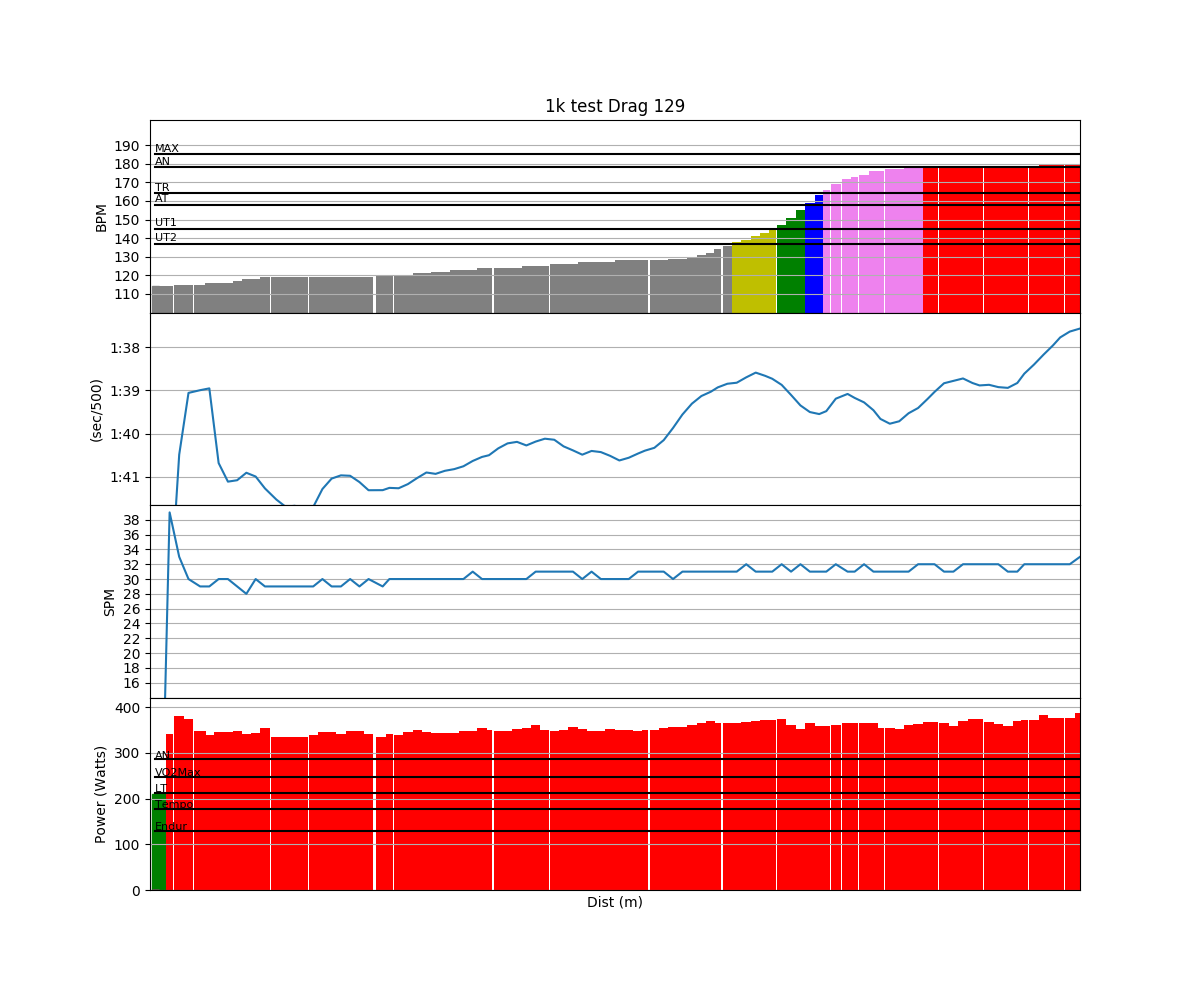
Again, this was an insufficient amount of rowing, so I decided to do some more of the fun Humon intervals.

Screen Shot 2019-06-15 at 8.49.25 PM.png

Today, I aimed at doing longer intervals at lower power just to watch and learn what the app did.  It did take a bit longer to get to red and longer to plateau.

Wednesday, June 5 – 5 mile run in Alexandria VA

I was Alexandria for an offsite strategy meeting.  I got up early and went for a run.  Our hotel was right on the shore of the Potomac across from Washington.  There was a nice path along the river so it seemed like a good chance to try out the Humon Hex running.

Screen Shot 2019-06-15 at 9.01.51 PM.png

I am the world’s slowest runner, but it seemed like a fun idea to try to run keeping it in the green zone.  I always tend to push too hard on runs and this might help me with my pacing.

Screen Shot 2019-06-15 at 8.56.35 PM

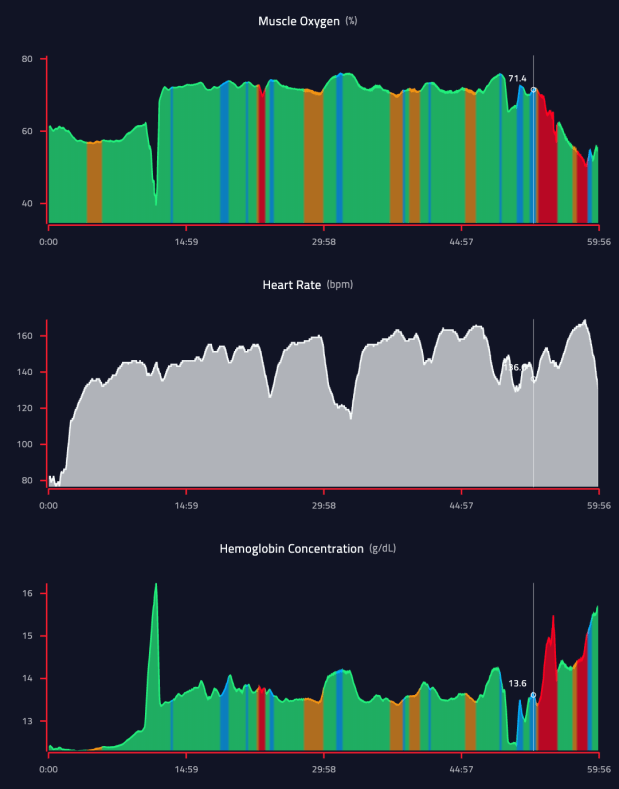
All was well until I got to the 50 minute mark.  At that point, the velcro on the Humon strap decided that it liked grabbing onto the inside of my shorts more than the other velcro.  The huge variations and spikes after that in the plot are where I needed to stop and adjust and try to get it to stay.  I think if I run, I need to keep the sensor under the leg of my underwear.

After that, we were in meetings from 8am to 6:30pm.  Then we went to a team dinner.  I got back at my hotel around 10pm, pretty tired.

Thursday – June 6 – Walk around the National Mall

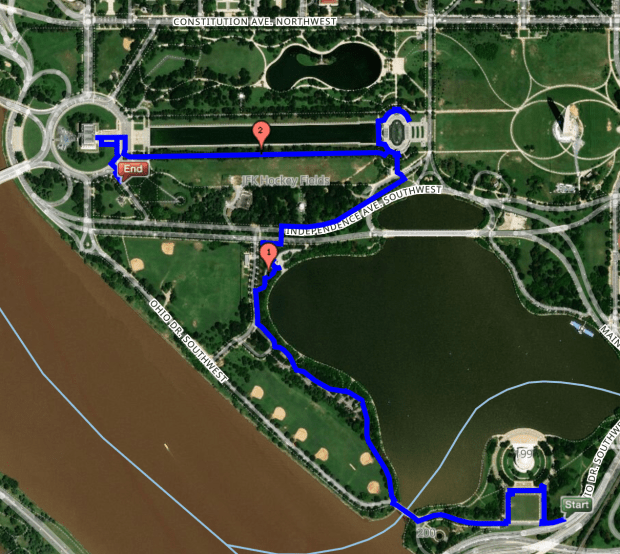
Part of the offsite meeting was a group walk around the National Mall.  We met at the ungodly hour of 5:30Am in the lobby of our hotel and took a 15 bus ride.  We were let off at the Jefferson Memorial.  We walked through the FDR memorial, then to the WWII memorial, and finally to the Lincoln Memorial.  A nice 2.5mile walk.

Screen Shot 2019-06-15 at 9.12.33 PM.png

Then another long day of meetings and another dinner.  I had too much to drink and I felt awful for the next 3 days.  I just can’t drink like I could when I was younger.

Friday – June 7 – Nothing

I had an early morning flight back to Boston, felt horrible all day, and couldn’t wait to get to bed that night.

Saturday – June 8 – 3 x 20′ / 2′ L4

At home, on slides.  Still feeling subpar.  Today’s adventure was to see what a typical L4 looked like from a Humon perspective.  Here’s the rowsandall view.

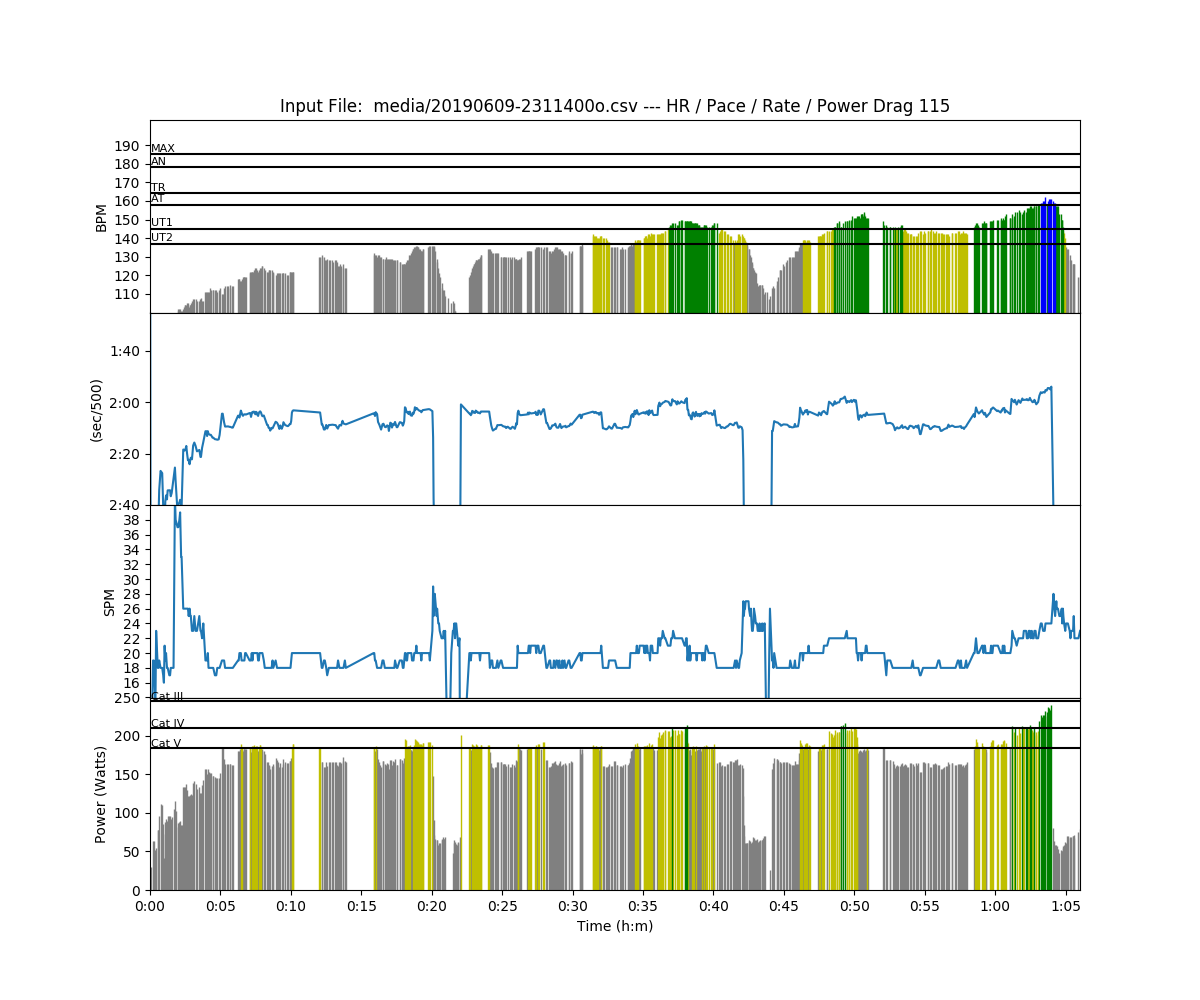
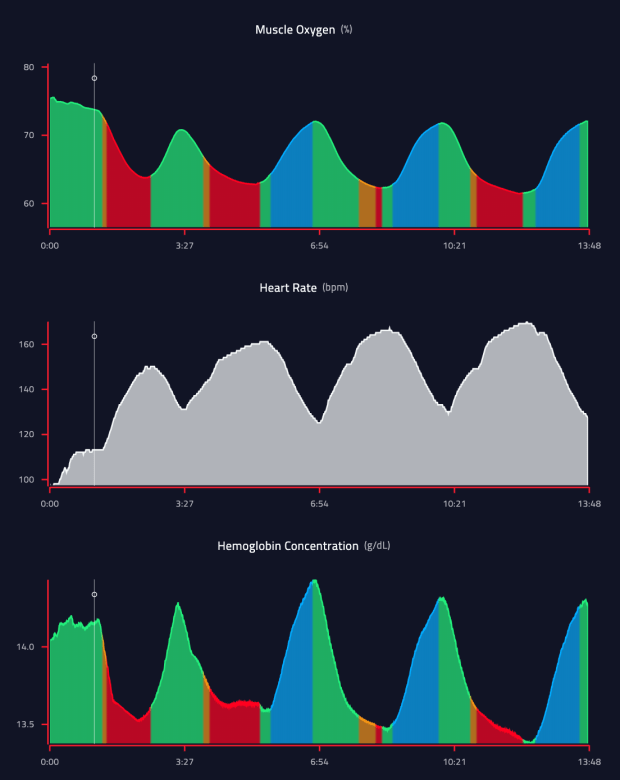
And here is the same thing from Humon.

Screen Shot 2019-06-15 at 9.18.08 PM

So, it appears that from a Humon perspective, I am doing my steady state work at too high an intensity.  I am OK seeing the orange, but red means that my lactate is going above 4.0mmol.  It’s good the see that it recovers in the lower stroke rate sections, but I think I should probably back off the intensity more.


The rest of my testing

Sunday – Oct 21: 10″ peak power test

Started with a Fletcher warm up, as one does.

Then I got myself ready for a wild ride.  Damper up to 10, feet strapped in tight, crank some good tunes and get ready for action.

I set the erg for 1′ work and 2 minute rest intervals.  I only rowed hard for the first 10 to 15 seconds of each interval.

Well, that’s not very satisfying.  Here’s the pace, power and rate as different charts

The point of a peak power test is to see the maximum power (or lowest split) that you can get over a 10 second blast.  The test protocol is defined here.

I did 5 sprints with the erg on the floor, which is the test standard, and then 2 sprints with the erg on slides, which is a f&*^ing blast!

I discovered something interesting with this test.  Under some circumstances, painsled does not log every single stroke. Here’s the data…

foo

The last column is the stroke count and there is no data for stroke 1,2,3,4,7,9.  So that means that the data that I have is somewhat unreliable.

What I saw on the monitor was a minimum split of 1:18 on most of the static reps.  I saw one pull with a 1:17.   That is 1 split off my all time best low pull.  I took the highest wattage of any of the recorded strokes and that was 1:17.8 or 742W.

On slides, I saw 1:12 on the monitor in both reps, that’s a whopping 923W.  Of course I could rate up to about 60 spm on slides which helped out a bit.  Needless to say, the static results are the ones that will be used for planning training.

Monday, Oct 22 – 1K test

I hate Monday’s.  I never get enough sleep, and I am working out first thing in the morning, usually after working out in the afternoon the day before.  This Monday was no exception.  But I really wanted to get this set of fitness tests behind me.

What was left?  The 1K test.  The soul of simplicity.  Row 1000m as fast as I can.  Use the average power as a proxy for my VO2max wattage.

To begin, the ritual fletcher warmup must be completed.

Apparently, Monday morning’s don’t suck.  I was a bit faster, with much better HR response than on Sunday.  Buoyed with new confidence, a strapped in for 3 minutes of hell (the first 15 seconds aren’t really so bad).

Actually, the first 250m was just fine.  I set out with a goal of matching my test from last year.  This was an average split of 1:39.4.  I guess I was pretty juiced because my average pace was a 1:37.6 over the first 250.  In the second 250, I started to really feel the burn and I dialed it back, just a hint to 1:38.6.  When I crossed the 500m mark, I was in respiratory distress, but I found I could tweak the rate up just a little and calm my breathing down.

Around 700m, my legs were burning, but with only 30 or so strokes to go, I closed my eyes and counted to 10.  I opened my eyes and I there was about 210m to go.  I did it again.  120m to go.  And the splits were getting better, not worse.  I counted down the last ten, and then there were two strokes to go.  Done.  3:15.2.  Boom.  Fastest 1k that Ive done since my 3:10.5 PB back in 2014.

I did a slow 2k to cool down.  I had a nasty erg cough the rest of the day, but it was totally worth it.  I ranked it on the C2 logbook.  19th out of 403 for the men’s 50-59 heavies.  3rd best for USA.

So that concluded the fitness tests.  The results…

Screen Shot 2018-10-28 at 3.19.35 PM.png

Compared to a year ago.

  • Peak power:  +21W
  • 1000m: +20W
  • 20′ test: +15W
  • 75′ test: +13W

I’ll be trying to figure out what that means for winter training with Marlene over the next couple of weeks, but looking at the numbers, my strongest performance was at 1000m.  Since my focus is head racing, I will need to work on aerobic capacity, and lactate threshold.


Thursday: 20′ test

I’ve been a bad boy.  I haven’t done any formal fitness testing since December of last year.  It’s time to get an idea of where I stand as the OTW season ends and I need to plan my winter training.  There are four tests to perform

  • 1′
  • 1000m
  • 20′
  • 75′

On Thursday morning, I decided to do the 20′ test.  To make things consistent, I do these tests on a static erg.

I’ve done 2 20′ tests before.  In October of last year, I pulled 244w.  Then in December, I had improved to 259w.  I hoped I was in similar shape to December, but I really had no idea.  I set off a little faster than that and hoped for the best.

I did a 2k warmup and got down to it.

I broke a little bit past the half way point with a couple of ugly HDs.  But I got back at it and kept pulling.  My avg splits popped up from a 1:49 to a 1:51 and it was just a matter of hanging on to the end.  I think if I had started a bit slower, I would have ended a lot faster.

In any case, even with the hiccups, I managed to equal my December mark of 259W.  Which I was delighted with.

          Workout Summary - media/20181018-1216000o.csv
--|Total|-Total-|--Avg--|-Avg-|Avg-|-Avg-|-Max-|-Avg
--|Dist-|-Time--|-Pace--|-Pwr-|SPM-|-HR--|-HR--|-DPS
--|05429|20:00.0|01:50.5|260.9|25.3|164.5|178.0|10.7
W-|05432|20:00.0|01:50.5|260.9|25.3|164.5|178.0|10.7
R-|00000|00:00.0|00:00.0|000.0|00.0|000.0|178.0|00.0
Workout Details
#-|SDist|-Split-|-SPace-|-Pwr-|SPM-|AvgHR|MaxHR|DPS-
00|01106|04:00.0|01:48.5|270.2|25.4|143.6|161.0|10.9
01|01095|04:00.0|01:49.6|265.9|25.4|164.4|168.0|10.8
02|01055|04:00.0|01:53.8|245.5|24.5|169.0|171.0|10.8
03|01080|04:00.0|01:51.1|254.8|25.0|169.5|174.0|10.8
04|01096|04:00.0|01:49.4|268.3|26.2|176.0|178.0|10.5

I did a slow 2k cool down and headed for the showers.

Sunday: HM / 75′ Test

Saturday:  Rest day

Sunday: I was scheduled for a 75′ test, but I liked the idea of getting a ranking distance done.  So, I decided to make it a half marathon.  Last 75′ test, I was at a 1:59.2 split.  Last week, I did a hour of power at r22 and a 1:57 pace.  I thought I should probably be able to improve my 75′ pace to around a 1:58.

My plan for the piece was pretty simple.  Try to hold 1:57/1:58 on the screen and keep the rate around 23.  If I felt like I was getting in trouble, bleed off a pace a bit at a time and try to keep the avg pace below 1:58.

The plan worked.  My HR was higher than I expected, but I just tried to ignore it and concentrate on how I felt, my RPE.  I felt pretty good, at least through halfway.  The second half was tough.  My HR was above 175 for most of the second half.  By the time I got to 7000m to go, I needed to slow down a bit more and that seemed to stabilize things.  I just counted strokes in each 1000m, it was usually 89 to 92 strokes and tried to avoid thinking about how much more time I had to keep going.  By the time I hit the 75′ mark at 1:57.9 pace, I knew I was going to make it and I started to accelerate a bit.

The last 1000m was a painful blur.

         Workout Summary - media/20171217-1820300o.csv
--|Total|-Total-|--Avg--|-Avg-|Avg-|-Avg-|-Max-|-Avg
--|Dist-|-Time--|-Pace--|-Pwr-|SPM-|-HR--|-HR--|-DPS
--|21097|82:49.0|01:57.8|214.1|23.4|170.8|181.0|10.9
W-|21097|82:50.0|01:57.8|214.1|23.4|170.7|181.0|10.9
R-|00000|00:00.0|00:00.0|000.0|00.0|000.0|181.0|00.0
Workout Details
#-|SDist|-Split-|-SPace-|-Pwr-|SPM-|AvgHR|MaxHR|DPS-
00|00097|00:21.8|01:52.1|215.5|20.0|100.0|112.0|13.4
01|01000|03:53.6|01:56.8|219.6|22.5|146.1|155.0|11.4
02|01000|03:53.7|01:56.9|219.3|22.9|157.4|162.0|11.2
03|01000|03:53.9|01:56.9|218.7|23.1|161.5|165.0|11.1
04|01000|03:54.1|01:57.1|218.2|23.1|165.2|166.0|11.1
05|01000|03:54.5|01:57.3|217.1|23.2|167.0|168.0|11.0
06|01000|03:54.3|01:57.1|217.6|23.2|168.2|170.0|11.1
07|01000|03:54.9|01:57.5|216.1|23.1|169.7|171.0|11.1
08|01000|03:55.2|01:57.6|215.2|23.1|170.9|172.0|11.0
09|01000|03:55.7|01:57.8|213.9|23.2|171.6|172.0|11.0
10|01000|03:55.8|01:57.9|213.5|23.2|172.8|174.0|11.0
11|01000|03:55.9|01:58.0|213.1|23.1|173.9|174.0|11.0
12|01000|03:56.3|01:58.2|212.2|23.6|174.7|175.0|10.8
13|01000|03:56.6|01:58.3|211.5|23.1|175.2|176.0|11.0
14|01000|03:56.6|01:58.3|211.3|23.2|175.0|175.0|10.9
15|01000|03:57.6|01:58.8|208.9|23.3|175.0|175.0|10.8
16|01000|03:57.9|01:59.0|207.9|23.6|175.5|177.0|10.7
17|01000|03:57.2|01:58.6|209.8|23.4|177.0|177.0|10.8
18|01000|03:58.5|01:59.2|206.4|23.4|176.8|177.0|10.7
19|01000|03:57.9|01:59.0|207.8|23.6|177.0|178.0|10.7
20|01000|03:56.2|01:58.1|212.5|24.8|179.7|181.0|10.3
21|01000|03:52.1|01:56.0|225.4|25.6|180.3|181.0|10.1

So, I hit my target for the 75′ fitness test.  I’ve updated the results on the google sheet.  I started at about 85% of my PR watts at the beginning of this 6 week training block.  Now my 20′ test and 75′ tests are both at roughly 90% of PR watts.  I’m happy with that kind of progress.

Screen Shot 2017-12-17 at 8.33.09 PM.png

Tomorrow:  4 x 20′ / 3′ nice and slow.

Wednesday: 20′ Test

I did a 20′ test as part of a battery of 4 tests back at the beginning of November. At that time, I struggled with the test, aborted an attempt, and then tried again at a slower pace on the next day.

The first attempt, I tried to hold a 1:51 pace and I lasted 6 minutes.  In the second attempt, I backed off to 1:53 and it was close to a maximum effort, but I managed to hold that through the piece, finishing with a 1:52.7 pace (5233m, 244W)

Today, based on my recent workouts, especially Monday’s 6x(5’@28,5’@18) workout, I thought that I might have made enough progress to attempt 1:51 again.  At least I thought I could give it a shot.

I ended up heading to the gym in the late afternoon.  I warmed up with an easy 2K.

Then into the main event.  Pretty simple plan.  Row at r25 and 1:51 pace.  Count strokes in sets of 100 and hope for the best.

It went as well as I could have hoped.  I kept the display bouncing back and forth between 1:50 and 1:51 through the first 4 sets of 100 strokes.  With 100 strokes left, I was struggling, but the displayed average was 1:50.3.  At this point, I gave myself permission to let the splits dance between 1:51 and 1:51.  That was just enough relief  to get me refocused on rowing well.  I got down to 50 strokes to go and I wound back up the speed and counted down to the finish.

End result: 5430m, 259W, 1:50.4 pace

Workout Summary - media/20171213-2225590o.csv
--|Total|-Total-|--Avg--|-Avg-|Avg-|-Avg-|-Max-|-Avg
--|Dist-|-Time--|-Pace--|-Pwr-|SPM-|-HR--|-HR--|-DPS
--|05432|20:00.0|01:50.5|258.7|25.1|167.2|180.0|10.8
W-|05435|20:00.0|01:50.4|258.7|25.0|167.1|180.0|10.9
R-|00000|00:00.0|00:00.0|000.0|00.0|000.0|180.0|00.0
Workout Details
#-|SDist|-Split-|-SPace-|-Pwr-|SPM-|AvgHR|MaxHR|DPS-
00|01092|04:00.0|01:49.8|257.3|24.4|144.9|162.0|11.2
01|01087|04:00.0|01:50.4|259.9|25.0|165.9|168.0|10.9
02|01085|04:00.0|01:50.6|258.2|25.0|170.5|173.0|10.9
03|01082|04:00.0|01:50.9|256.8|25.2|175.9|180.0|10.7
04|01089|04:00.0|01:50.2|261.2|25.7|178.4|180.0|10.6

I compared the row in detail to my last attempts.

First, comparing it to the 1:52.7 attempt.

  • Pace: this one was faster!
  • Rate:  Identical
  • Power:  better  today!
  • HR: close to identical, but I didn’t push it as high today.

Then I did a cool down.

I’m very happy with this.

Tomorrow:  4 x 20′ / 3′ at 2:06/r18

Lactate Step Test

Using the AIS Step Test Protocol

I estimated that my current 2k time would be around 7:00, or a 1:45 pace.  The protocol provides the following step powers

Screen Shot 2017-11-06 at 12.18.05 PM

Getting myself setup was a bit complicated.

  • HR sensor, connected to PM5
  • PM5 connected to painsled
  • headphones on, connected to iphone
  • Spotify set to my “8×500” playlist
  • Drag set to 130
  • Seat pad on erg
  • wet towel
  • dry towel
  • lancet tool
  • lactate meter battery OK
  • lay out 10 lactate test strips neatly
  • fan on
  • PM set to 4 minute intervals/1 minute rests, display to power

Then I did a baseline lactate test, just to make sure that I remembered the process.

  • wipe hands with dry towel
  • wipe sample finger with wet towel
  • dry sample finger
  • lance fingertip
  • pick up meter with non-sample hand
  • pick up strip with sample hand and insert strip
  • make sure meter has woken up
  • visually judge size of droplet
    • If it is too small, put hand down low for 5 seconds
  • dab droplet with strip, starts 13 sec count down on meter
  • wipe finger
  • get a drink
  • get feet set for next interval
  • write down reading

When executed well, this whole process takes about 45 seconds.  If there are any hiccups, it takes the whole 1 minute rest time.

The baseline was 1.4mmol/ml which is a perfectly reasonable reading.

Then I did the test.  The steps start ridiculously easy.  The key thing in my mind is to try to hit the power exactly on every stroke.  I ended up bouncing a few watts up and down, but staying focused on the target kept me occupied while it was easy.

The target for the last step is “max”.  I changed the display from watts to pace per 500.  I wasn’t quite sure how hard I could hold for 4 minutes.  I decided to try to make sure I did it faster than 1:45.  As it turned out, I was able to accelerate in the last minute, so I probably could have pushed it a bit harder, but my HR was above 180 at the end so I was working pretty hard.

11-7a

11-7b

OK, so I did the test.  What’s the point?

The main reason to do the test was to have a baseline to compare after training blocks are completed.

Beyond that, the curve can be used to estimate my current Lactate Threshold.  There are multiple ways to extract this from the curve.  The simplest is the power at which the lactate level exceeds 4.0mmol/ml.  This gives an estimate of 243W (1:52.9).  A more conservative method is to draw a best fit line for the sub-2.0mmol points and another for the steep part of the curve, and the point where they meet is the LT.

11-7c.png

This method yields about 238.  So, about 240 is a good guess.  How does this compare with the 20′ test?  The test measured 244W.  So there!

The other useful output is a first cut at appropriate steady state training power.  The goal here is to train at the highest power that results in a steady state lactate level at or below 2.0mmol/ml.  From this test, training power should be between 180 and 205W.

Other testing I have done in the past shows that lactate tends to drift up slowly over a long steady state session, so something towards the bottom of this probably more appropriate.

Fall 2017 Fitness Tests

Screen Shot 2017-11-03 at 12.40.07 PM

This is in a google sheet: here

A little explanation:

  • Power:  Is the average power for the test (or the peak power in the case of the peak power.
  • PR Power:  Is the best performance over the past 4 years for the closest thing to these tests
    • Peak Power:  Low Pull Test in 2014
    • 75 Minute Test: Half marathon in December, 2015 (79:55 minutes vs 75:00)
    • 1K test: 1K test in March of 2014
    • 20′ Test: 6K test in December of 2013 (21:32 vs 20:00)
  • % PR Std:  This is how far I am from my best ever performance for this set of tests
  • 500m: Avg or peak split
  • Meters: Distance rowed, significant for 20′ and 75′ rows
  • SPM:  Avg stroke rate for the piece
  • Ratios:
    • 75′ test: % of 1K test power
    • 1K test: % of peak power
    • 20′ test: % of 1K test power
  • Ideal:  This is the range define my RoyleRow as idealized target ranges to help focus training planning
  • PR Ratios:  This is the same ratios calculated from PR powers instead of current test results.

The purpose of this exercise is to provide insight about training.  So, what insights are there.

  1. It is cool to see how consistent the ratios are from my best performance to my current performance.  I think that a big part of this is physiology.  My VO2Max to peak power is higher than target range, and my anaerobic and aerobic thresholds are below the ideal ranges by similar amounts.  It will be interesting if Marlene will want to focus on trying to raise my threshold results relative to my VO2Max, or if she will want to just push the whole profile to the right
  2. My peak power is closer to my PR levels than my distance stuff.  I think that this makes a ton of sense.  My total training load, and especially my load of aerobic training was much lower over this past summer than in past seasons due to travel, boat problems and injury.
  3. I was disappointed with the anaerobic threshold results, but it sure explains why I didn’t do as well as I hoped in the HOCR.  It appears that this furthers from my best performance and furthest from the ideal ranges.  This is also related to problems with training this summer and fall.  I essentially had 21 total days from when I restarted “real” training after my back injury before until the HOCR.  That was not enough time to move my anaerobic threshold much.

I will find out soon what Marlene wants to do, but my thought is to work on aerobic fitness using lactate guided training power, and complement that with a few short sessions a week at higher intensity.  I would also like to devote more training time to fixing some core strength and imbalance issues.

If at first you don’t succeed…

After yesterday, I was nervous and frankly full of dread about doing the 20′ time trial today.

I saw yesterday that 1:50 was too aggressive as a target, so today, I backed off to 1:53.

I started with a very short 1k warmup.

Workout Summary - media/20171103-1135460o.csv
--|Total|-Total-|--Avg--|-Avg-|Avg-|-Avg-|-Max-|-Avg
--|Dist-|-Time--|-Pace--|-Pwr-|SPM-|-HR--|-HR--|-DPS
--|01000|03:56.0|01:58.3|210.9|22.2|129.3|147.0|11.4
W-|01000|03:56.0|01:58.5|207.5|21.9|128.3|147.0|11.7
R-|00000|00:00.0|00:00.0|000.0|00.0|000.0|147.0|00.0
Workout Details
#-|SDist|-Split-|-SPace-|-Pwr-|SPM-|AvgHR|MaxHR|DPS-
00|00150|00:36.6|02:02.0|159.3|16.5|080.1|103.0|14.9
01|00100|00:22.2|01:51.2|236.9|23.9|113.6|121.0|11.3
02|00150|00:37.2|02:04.0|191.0|21.2|130.9|136.0|11.4
03|00100|00:22.5|01:52.7|249.7|25.3|137.9|139.0|10.5
04|00150|00:37.5|02:04.9|187.5|21.1|142.2|144.0|11.4
05|00100|00:22.1|01:50.6|247.7|25.3|141.2|142.0|10.7
06|00150|00:37.2|02:03.9|191.0|21.5|144.8|147.0|11.2
07|00100|00:21.6|01:47.8|265.2|25.3|145.0|146.0|11.0

Then onto the main event.

  • Pace target: 1:53
  • Rate target: 25

I promised myself to not quit on this test.  If I needed to, I would slow down by a split or two, but I would keep going and just get it done.  After all the point was to establish a baseline for the purpose of planning my training.  If the test shows that I am weak here, then that is useful data.  Useful data that really hurts to collect.

         Workout Summary - media/20171103-1135300o.csv
--|Total|-Total-|--Avg--|-Avg-|Avg-|-Avg-|-Max-|-Avg
--|Dist-|-Time--|-Pace--|-Pwr-|SPM-|-HR--|-HR--|-DPS
--|05318|20:00.0|01:52.8|243.8|25.1|169.2|183.0|10.6
W-|05324|20:00.0|01:52.7|243.7|25.1|169.1|183.0|10.6
R-|00000|00:00.0|00:00.0|000.0|00.0|000.0|183.0|00.0
Workout Details
#-|SDist|-Split-|-SPace-|-Pwr-|SPM-|AvgHR|MaxHR|DPS-
00|00537|02:00.0|01:51.6|239.1|23.2|134.8|157.0|11.6
01|00534|02:00.0|01:52.4|249.2|25.0|159.9|164.0|10.7
02|00535|02:00.0|01:52.2|247.5|25.0|165.6|167.0|10.7
03|00534|02:00.0|01:52.5|246.3|25.1|168.2|170.0|10.6
04|00533|02:00.0|01:52.6|245.2|25.1|170.5|171.0|10.6
05|00533|02:00.0|01:52.7|244.8|25.3|172.5|174.0|10.5
06|00531|02:00.0|01:53.0|242.4|25.2|176.3|179.0|10.5
07|00527|02:00.0|01:53.9|237.6|25.2|179.0|181.0|10.5
08|00526|02:00.0|01:54.2|235.0|25.5|181.9|182.0|10.3
09|00536|02:00.0|01:52.0|250.1|26.2|181.8|183.0|10.2

This was pretty hard from beginning to end.  I was very worried about halfway through and I started playing around a little bit with rate and pressure to try to find a comfortable groove.  I was counting blocks of 125 strokes for each 5 minute section.  My HR was above 95% of HRR with 6 minutes to go and I was pretty miserable in the last 5 minutes.  I eased off a bit until I saw that I had 2 minutes to go, actually when I had counted to 75 strokes in the last section.  Then I pushed again to try to finish strong while counting down the last 50 strokes.

So, I ended up a bit below target, but this was a good solid test.  I think it reflects where I am right now.

After I caught my breath, I did a 3K cool down

          Workout Summary - media/20171103-1150290o.csv
--|Total|-Total-|--Avg--|-Avg-|Avg-|-Avg-|-Max-|-Avg
--|Dist-|-Time--|-Pace--|-Pwr-|SPM-|-HR--|-HR--|-DPS
--|03000|13:09.0|02:11.6|156.5|19.8|151.3|163.0|11.5
W-|03000|13:10.0|02:11.7|154.4|19.7|151.4|163.0|11.6
R-|00000|00:00.0|00:00.0|000.0|00.0|000.0|163.0|00.0
Workout Details
#-|SDist|-Split-|-SPace-|-Pwr-|SPM-|AvgHR|MaxHR|DPS-
00|00500|01:58.0|01:58.0|201.6|21.8|136.7|156.0|11.7
01|00500|02:04.7|02:04.7|182.3|21.0|161.4|162.0|11.4
02|00500|02:09.1|02:09.1|162.7|20.2|159.8|163.0|11.5
03|00500|02:14.4|02:14.4|145.2|19.0|155.3|157.0|11.7
04|00500|02:19.9|02:19.9|129.0|18.5|149.9|152.0|11.6
05|00500|02:24.1|02:24.1|117.5|18.4|144.9|147.0|11.3

Tomorrow:  Recovery session.  If the weather is nice, I’m hoping for a open water row.

I’m compiling the results and I I’ll post the analysis in a little while


Well that didn’t go well

Yesterday, was a rest day.  I spent the day on appointments and errands

  • Dentist appointment:  Which made me unhappy because I apparently have a cracked tooth and need a crown.
  • PT appointment:  Which hurt like hell.  I have two issues.
    • My left glute is weak and this is causing a misalignment in my hips.  This has caused a chain reaction of sorts resulting in my left quad being all tight and my legs presenting as different lengths.
    • The very bottom part of my spine above and below my L5 is a bit out of alignment and the PT believes that I have impingement between vertebrae when I lean back at the finish.  I need to work on rocking my pelvis forward in rowing and in real life.
    • First he did some deep tissue massage to try to get my lower spine unkotted.  That wasn’t so bad.  Then he moved onto the left quadricep and tried to work out some adhesions that had formed between the different elements of the quad.  He used a combination of deep tissue massage and active release in two different poistions.  This hurt so much that I wept.  After that, he showed me a couple more exercises to work on strengthing my glutes and obliques to try to support better pelvic posture.  I limped out of the appointment.
  • From there, I headed off to the Apple store.  I dropped my phone on a concrete floor on Sunday and cracked the screen.  I discovered that the screen can be replaced reasonably easily.  They said it would be done in about 90 minutes.
  • Next stop was a radiology center.  In my hip X-Rays, the radiologist saw a “deformity” on one of my ribs on the right side and recommended a follow up x-ray of the area.  So, I did that.  I wonder what will come of it?
  • Then back to the Apple store to pick up my repaired phone.

Whew!

Thursday

The plan for today was a 20 minute test.  I got a good night’s sleep and I headed into work.  I was in the gym by about 6:45.  I started with a 2k warmup.

Workout Summary - media/20171102-1125300o.csv
--|Total|-Total-|--Avg--|-Avg-|Avg-|-Avg-|-Max-|-Avg
--|Dist-|-Time--|-Pace--|-Pwr-|SPM-|-HR--|-HR--|-DPS
--|02000|07:59.0|01:59.8|213.3|21.7|143.5|161.0|11.6
W-|02000|07:59.0|01:59.8|205.9|21.2|142.3|161.0|12.0
R-|00000|00:00.0|00:00.0|000.0|00.0|000.0|161.0|00.0
Workout Details
#-|SDist|-Split-|-SPace-|-Pwr-|SPM-|AvgHR|MaxHR|DPS-
00|00300|01:15.4|02:05.7|159.1|16.1|111.8|127.0|14.8
01|00200|00:46.9|01:57.3|214.0|21.9|133.7|138.0|11.7
02|00300|01:16.8|02:08.1|173.1|19.5|141.8|143.0|12.0
03|00200|00:45.4|01:53.4|235.2|23.2|143.6|147.0|11.4
04|00300|01:16.6|02:07.7|171.3|20.0|149.8|151.0|11.8
05|00200|00:43.4|01:48.4|265.6|24.9|151.2|155.0|11.1
06|00300|01:15.0|02:05.0|188.3|21.3|156.9|158.0|11.3
07|00200|00:39.9|01:39.8|348.6|29.1|157.6|161.0|10.3

Then, I gathered my courage for a 20 minute time trial.  Based on the rowsandall OTE CP Analysis, my projected power for a piece this length was between 245W and 285W (1:52.6 to 1:47.1).  The wide band is the result of pretty funny looking CP curve.

cp curve

Why does it look like this?  Well, that’s because the data extracted from erg pieces (red dots) is based on 3 strong results (75′, 1km, LP).  The plateau from 50 seconds to 200 seconds is the data from the 1K test.  The low end was set by the peak power test.  The upper end was set by the 75′ test.

Just from recent experience, it seemed that 1:47 was way to big of an ask.  I thought that 1:50 might work, but was risky.  I decided to start there and slow down if needed.

I got myself setup and got going.  I held 1:50 through the first 1250m, but I was in a lot of respiratory distress, and my HR was a bit higher than I was hoping to see.  I basically lost hope and stopped.

Workout Summary - media/20171102-1125450o.csv
--|Total|-Total-|--Avg--|-Avg-|Avg-|-Avg-|-Max-|-Avg
--|Dist-|-Time--|-Pace--|-Pwr-|SPM-|-HR--|-HR--|-DPS
--|01580|06:00.0|01:53.9|259.1|25.1|158.3|172.0|10.5
W-|01505|05:30.0|01:49.7|262.0|25.2|157.6|172.0|10.8
R-|00076|00:30.0|03:16.1|200.8|23.1|172.0|172.0|06.6
Workout Details
#-|SDist|-Split-|-SPace-|-Pwr-|SPM-|AvgHR|MaxHR|DPS-
00|01505|05:30.0|01:49.7|262.0|25.2|157.6|172.0|10.8

Humph.  That was disappointing.  I sat around for a little while trying to figure out what happened.  I had a bit of DOMS in my quads from the PT appointment, but that didn’t bother me much.  My HR was definitely a bit high and I was struggling, but slowing down didn’t seem to work.  I think part of my problem was just an unwillingness to endure the discomfort today.

After mulling it over for a few minutes, I decided to give it another try, but this time at 1:52.  This didn’t go any better.  I lasted about the same amount of time, and gave up when it started to hurt.

         Workout Summary - media/20171102-1126000o.csv
--|Total|-Total-|--Avg--|-Avg-|Avg-|-Avg-|-Max-|-Avg
--|Dist-|-Time--|-Pace--|-Pwr-|SPM-|-HR--|-HR--|-DPS
--|01211|04:33.0|01:52.7|244.6|24.8|155.4|173.0|10.7
W-|01212|04:33.0|01:52.7|244.6|24.8|155.4|173.0|10.8
R-|00000|00:00.0|00:00.0|000.0|00.0|000.0|173.0|00.0
Workout Details
#-|SDist|-Split-|-SPace-|-Pwr-|SPM-|AvgHR|MaxHR|DPS-
00|01212|04:33.0|01:52.7|244.6|24.8|155.4|173.0|10.8

After that, I gave up and just did a cool down.

I wanted to compare these failures to the reasonably successful 6K session that I did on October 9th.  The orange trace was the first attempt.  You can see I started at about 265W and faded a bit toward 250W through the first 5 minutes.   The HR response was much higher today than in the 6K test.  It seems pretty clear that that the fatigue from the first attempt was effecting the HR for the second attempt.

So, now I try again tomorrow.  target is 250W.

Tuesday: 1K Test

Monday:  The test protocol called for a rest day, and that was a good thing.  I was in meetings from 7am to 7pm.

Tuesday:  Today’s goal was a 1K test.

This test measures your VO2 max. Row 1000 meters at racing pace at your absolute best effort. Record your average watts. Stroke rates may range from 26-28 up to above 34. Also note in your data the average 500-meter split, total time, and stroke rate for future reference. Make sure to warm up properly and do a cool down row for at least 15 minutes easy after the test to help recovery.

So, scary words…absolute best effort.  The question is what is my pace or power target.  The CP pace predictor said that I should target about 300W.  This is about a 1:45 pace.  I felt pretty sure that I could do better than that.  Looking at the test results so far.

  • Peak power:  1:18.6 vs 1:16.9 PR in 2015 ( 721W vs 770W – 94% of PR)
  • 75′ test: 1:59.2 vs 1:53.6 HM PR in 2016 ( 206.7W vs 238W – 87% of PR)

So, it I thought it would be reasonable to look at targeting something like 90% of 1K PR watts.  That PR dates from 2014 and was 3:10.5, 1:35.2 pace, 406W.  90% of that would be 365W which translates to 1:38.6 pace.  That, frankly was a little bit scary for me.  So I decided to start off around 1:41 and see if I had the oomph to speed up in the second half.

So, that was my plan.  I started off with an aggressive Fletcher warmup.

          Workout Summary - media/20171031-1140300o.csv
--|Total|-Total-|--Avg--|-Avg-|Avg-|-Avg-|-Max-|-Avg
--|Dist-|-Time--|-Pace--|-Pwr-|SPM-|-HR--|-HR--|-DPS
--|05011|19:59.0|01:59.7|213.7|21.0|157.4|175.0|11.9
W-|05013|19:59.0|01:59.7|212.2|20.9|156.7|175.0|12.0
R-|00000|00:00.0|00:00.0|000.0|00.0|000.0|175.0|00.0
Workout Details
#-|SDist|-Split-|-SPace-|-Pwr-|SPM-|AvgHR|MaxHR|DPS-
00|00940|03:54.0|02:04.5|176.7|17.9|129.7|146.0|13.4
01|00995|04:01.0|02:01.1|196.8|19.9|151.1|156.0|12.4
02|01040|04:01.5|01:56.1|223.9|22.3|161.3|166.0|11.6
03|01036|03:58.5|01:55.1|250.0|23.2|168.9|175.0|11.3
04|01001|04:04.9|02:02.3|212.7|21.2|171.5|175.0|11.6

This was a bit disconcerting.  It seemed like my HR was a bit too high, and I was breathing hard.  I decided this was nerves.  I waited a bit more than 5 minutes after finishing to get set up for my 1K.

For some reason, the HR monitor lagged significantly.  Not sure why.  I’ve seen that with the Wahoo, but I hadn’t yet for the Polar OH1.

As for the row, it basically went to plan.  I focused on just hitting 30 spm and 1:41 at first and counted strokes.  I felt good at 250 and I pushed a bit.  At 500, it was stinging, but I started to feel ambitious and I pushed the rate up a bit and managed to work the splits down so 1:38 and 1:39 were dancing on the screen.  I did pretty well, because I thought the world was ending around the 750m mark.  But I kept counting my strokes and knew that I had about 30 to go.  I just closed my eyes and counted down.  With 5 to go I opened my eyes and finished it off.  3:18.9.  356W.  Not so bad.  I guess the stretch target wasn’t far off.

I was pretty well shattered by that.  It took a couple of attempts to get going with a cool down and an hour to stop sweating.  Now I have a nasty erg cough and a glimmer of pride.  This workout ranked in the 93rd percentile (31st of 429 for my age bracket).

Tomorrow: Scheduled rest day.

Thursday:  20′ Test.  Gotta figure a pace for that one too!