Quiske Analysis of 4x2K

I mentioned that I used the Quiske pod on my row in Thursday.  Here are some of the plots from that

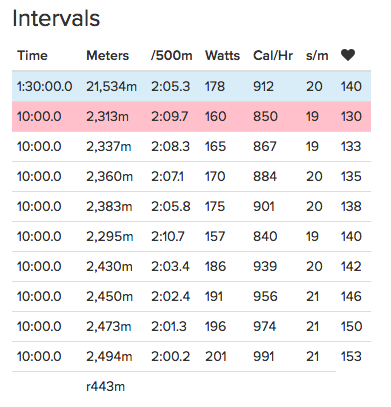
I took  sample of about 25 strokes near the end of each interval.  In each case, this part is on a part of the river that is reasonable straight.

The first and third interval had a tail wind and weere with the current.   The second and fourth headwind and against the current.  There was not enough wind to cause any chop, but the boat felt noticeably heavier going into it.

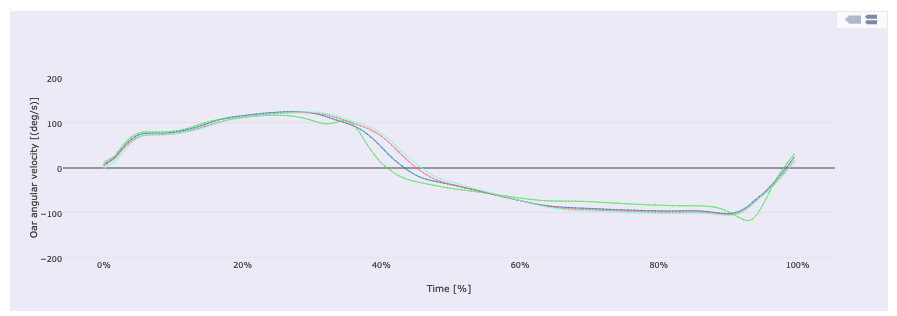
On the oar path diagram, I adjusted the pod to get it aligned to the horizon a bit better between the 1st and 2nd interval.  That’s why the green curve is canted at an angle.

So, what can I see from these data?

Boat Acceleration

  • The initial hump is too pronounced for this stroke rate.  I suspect that I am opening up my body too early in the drive.
  • There is a significant negative acceleration at the release, which means I am not extracting my oars cleanly.

Oar Acceleration:  I don’t know how to get much out of that plot

Oar Path:

  • Recovery shows a cupped shape.  That shows that I am dragging my oars, and then lifting them off the water at the catch
  • I am starting the drive with the oars not completely buried.  Oar depth increases through the first quarter of the stroke.
  • My oar depth is decreasing in last 2/3 of the stroke, which means I am washing out.  I need to pull into the release higher on torso.  (This will complicate cleaning up my releases)

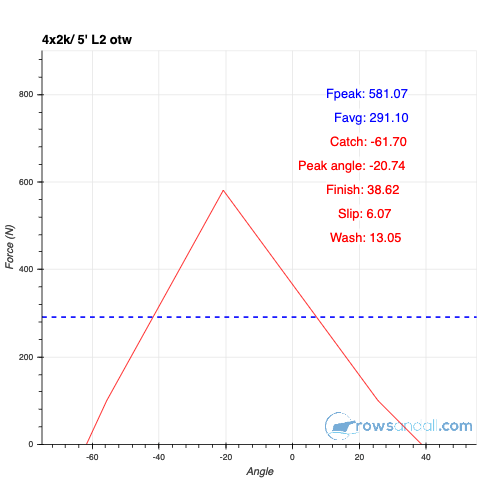
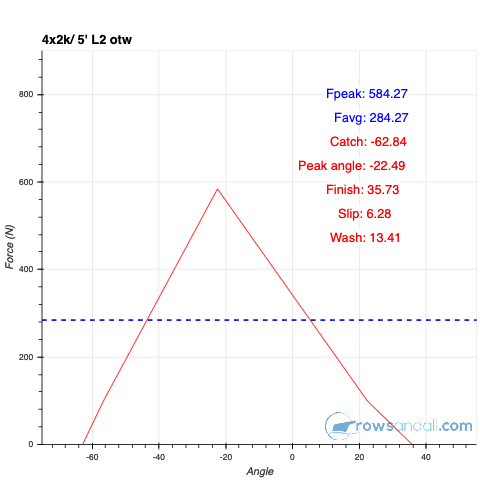
For comparison,  here are the force curves for each of the 4 sections.

Of course, right now, I hurt my back, so even putting my socks on is a struggle.  Once I my better, I think it’s time to get working on drills!

Side Video

These are video snippets from a session done on July 11, 2018.

Things I know

  • I’m overweight
  • My aerobic fitness isn’t as good as I want it to be.
  • I still break my knees too early

The first 5 videos are of drills that I did:

Delayed Feather:

King of the Mountain:

Half Slide:

Open Hands on Recovery

Pause at Body over


Then a couple of steady state rowing

3 minutes of r20

A quick rate ladder from r18 to r24


Gentle comments welcome!

Videos! KOM Drill and Rate Ladders

It seems like so long ago, but it was just last Saturday.  When I went out to Lake Quinsigamond for a outing with my pals at the Worcester Boat Club.

I set up for side video to see how I was doing with the feedback that my coach had provided.  For reference, here is the before video.

The things that I needed to work on.

  • Rigging:
    • Decrease inboard to reduce the amount of overlap at the crossover and give me more room at the finish.  (I went from 89cm to 85cm)
    • Move foot board to stern to give me more distance through the pin for my hips.  (I moved it 2cm to the stern)
    • Move the oarlocks down one spacer so that my hands would be lower during the drive.
  • Technique:
    • Get my heels down quicker in the drive and keep my heels down during recovery
    • Maintain outward pressure on the handles during recovery to get the blades off the water and stay more stable.
    • concentrate on hinging at the hips and keep my back straight.

She recommended that I include the King of the Mountain Drill into my routine.  I’ve do it in a couple of workouts so far.  You can tell from the video that I need to do it more.

Here’s what it is supposed to look like.  Link to Video

Here’s my version.

I don’t know what my problem was, but I was really tense during the drill.  I feel like I did a better job the first time I tried it.

Then it was into the work out.  The assignment was 4 x 12′ rate ladders.  I include 2 videos here.  The first is the last couple of minutes of the r18 section, 4′ at r24 and 2′ at r28.  This one was done with basically no wind.

So, what do I see.  I know it’s tough to make things out because of the position of the sun.

  • The rigging changes are good, and maybe should go even further.  My finishes look a lot better.
  • I am doing a little better in the way my body is hinging, but not much.
  • I seem to go deep at the catch and then come to a good depth in the last 2/3 of the drive.
  • My balance still sucks.

Here’s the second ladder.  Again the end of the r18 bit and all of the 24 and 28.  The sun is now behind the camera so the video quality is better.  The rowing is a bit worse.  There was a bit of head/cross wind and I went a bit too hard in the first one so I was starting to fatigue.

I look a kinda slumpy in this one.  I need to really work on sitting up straight in the boat.

Finally, because I can’t help myself.  Here’s another blooper.  When I started my second ladder, I managed to lose track of where a buoy was in front of me.  By the time I saw it again, I was too close to cleanly steer away from it, so I just braced for impact.

Not my proudest moment.  I guess I should have worn the sunglasses.


More musings on Lactate

Comparison of two lactate tests.

11-10a

Roughly similar, but lower readings for the powers below the aerobic threshold.  I think that’s a good thing.  4mmol power is about 5W higher now, also good.  HRs are right on top of each other which is just plain weird.

So I see this as a very hopeful sign.  I went from this baseline to setting most of my distance PBs using lactate based training.  There’s no reason I can’t do it again.


Lactate Step Test

Using the AIS Step Test Protocol

I estimated that my current 2k time would be around 7:00, or a 1:45 pace.  The protocol provides the following step powers

Screen Shot 2017-11-06 at 12.18.05 PM

Getting myself setup was a bit complicated.

  • HR sensor, connected to PM5
  • PM5 connected to painsled
  • headphones on, connected to iphone
  • Spotify set to my “8×500” playlist
  • Drag set to 130
  • Seat pad on erg
  • wet towel
  • dry towel
  • lancet tool
  • lactate meter battery OK
  • lay out 10 lactate test strips neatly
  • fan on
  • PM set to 4 minute intervals/1 minute rests, display to power

Then I did a baseline lactate test, just to make sure that I remembered the process.

  • wipe hands with dry towel
  • wipe sample finger with wet towel
  • dry sample finger
  • lance fingertip
  • pick up meter with non-sample hand
  • pick up strip with sample hand and insert strip
  • make sure meter has woken up
  • visually judge size of droplet
    • If it is too small, put hand down low for 5 seconds
  • dab droplet with strip, starts 13 sec count down on meter
  • wipe finger
  • get a drink
  • get feet set for next interval
  • write down reading

When executed well, this whole process takes about 45 seconds.  If there are any hiccups, it takes the whole 1 minute rest time.

The baseline was 1.4mmol/ml which is a perfectly reasonable reading.

Then I did the test.  The steps start ridiculously easy.  The key thing in my mind is to try to hit the power exactly on every stroke.  I ended up bouncing a few watts up and down, but staying focused on the target kept me occupied while it was easy.

The target for the last step is “max”.  I changed the display from watts to pace per 500.  I wasn’t quite sure how hard I could hold for 4 minutes.  I decided to try to make sure I did it faster than 1:45.  As it turned out, I was able to accelerate in the last minute, so I probably could have pushed it a bit harder, but my HR was above 180 at the end so I was working pretty hard.

11-7a

11-7b

OK, so I did the test.  What’s the point?

The main reason to do the test was to have a baseline to compare after training blocks are completed.

Beyond that, the curve can be used to estimate my current Lactate Threshold.  There are multiple ways to extract this from the curve.  The simplest is the power at which the lactate level exceeds 4.0mmol/ml.  This gives an estimate of 243W (1:52.9).  A more conservative method is to draw a best fit line for the sub-2.0mmol points and another for the steep part of the curve, and the point where they meet is the LT.

11-7c.png

This method yields about 238.  So, about 240 is a good guess.  How does this compare with the 20′ test?  The test measured 244W.  So there!

The other useful output is a first cut at appropriate steady state training power.  The goal here is to train at the highest power that results in a steady state lactate level at or below 2.0mmol/ml.  From this test, training power should be between 180 and 205W.

Other testing I have done in the past shows that lactate tends to drift up slowly over a long steady state session, so something towards the bottom of this probably more appropriate.

StravistiX – What going easier looks like

I like this tool.  The last 5 days, I’ve been going much easier and 9t shows in the reduction of my fatigue level (the grey area).  It also shows that my fitness is plateaued.  I think that has more to do with 6 rest days over the past 11 days.  I think if I can maintain 6 easy, 60-80 minute sessions a week, I will keep fatigue in check and make steady improvement in endurance.  That’s a good thing to do if I’m gonna row more than 20 miles in a race in July.

Screen Shot 2017-03-23 at 9.17.15 AM

More fun with Stravastix

I am really grateful for a post over on RowingMusings that introduced me to an add on to Strava called StravistiX.

It is an online tool that essentially does a version of TRIMP (Training Impulse), a method to measure total training load that uses both the duration and the intensity of a session.  Intensity is measured as a % of HRR.  (HRR is the delta between your maxHR and your RestingHR).

StravistiX has implemented a flavor of this as a pretty seamless add-on to Strava.  So, now I routinely upload each session to Strava, either directly, or as an export from rowsandall, and every week or so, I sync it to StravistiX.

This is the output I get.

Screen Shot 2017-03-08 at 10.01.27 PM.png

So, you can see in one chart the story of my training since January 15th.

On Januray 16th, I was cleared to get back to training after my knee surgery.  I’ve had a greater number of rest days than I normally plan (14 vs 8), mainly due to an insane business travel schedule.

Despite this, I have tried to keep on track with the Marathon training plan, and it seems to be paying off.  By the measures here, I am in overload right now.  I’m not sure if that is a bad thing or not.  And it seems to think that my fitness is improving.

I’m planning on reviewing this weekly and probably posting something about monthly.  Right now I’m doing it to learn.  Eventually, I might use it to guide the intensity of the training sessions I have planned.


StravistiX…This is pretty cool.

I’m just getting going on this, but I think I am going to make it a part of my data routine.  I’ve plugged in all the workouts that I’ve done over the past couple of weeks and I’m starting to see the utility of doing this.

Here’s my “form graph”.

Screen Shot 2017-02-07 at 10.03.32 AM.png

So, this says that I am in overload, which I guess is about right.  I need to make sure that all my training gets into Strava.

This should be interesting to watch with the Marathon training plan.


Sunday: Lactate 10′ Step Test

Plans for any training down on the Cape this weekend were disrupted by other priorities.  We had all kinds of appointments on Saturday morning, and the main mission for the day was to prepare the deck around the house for a coat of wood sealer.  This took much longer than I was hoping because I vastly underestimated how much deck there was to prepare.  (1400 SQ FT!)  Anyway, by the time that was done, I was not in the mood to do much of anything beside hang out with my wife and drink a couple of beers.

I was thinking I could go for a row on Sunday morning, but when I woke up, it was blowing like crazy.  The peak gust was 50mph (80km/h) and sustained winds were around 35mph (55km/h).  I didn’t even like the thought of trying to pedal a bike into that kind of a headwind, so I decided to wait until the afternoon and just do an erg session.

But what session to do?  I was planning on an early morning row in the Double with Joe on Monday morning, so I didn’t want anything too intense.  And there was a fresh new box of lactate test strips that had just arrived.  So, I quickly decided to do the same 10 minute step test that Sander did last week.

My protocol:

  • No warmup
  • 10 minute steps
  • 1:30 rests
  • start at 160W and increment by 5W to 200W
  • Measure HR throughout and lactate at the end of each step

The purpose of the test is to help define an appropriate steady state intensity for endurance training.  I suspect that it would be around 180-185W or so.

When yo put the data  into a plot, it looks a bit weird.  The test did not go entirely smoothly.  I suspect the lactate test for 170 was contaminated with sweat, leading to a high reading.  The one at 175 had to be redone due to an “E-4” (insufficient sample size).  At 180, I also suspect contamination.  The rest of the readings I think were good.  I had my method down pretty smoothly by then and I was doing a good job cleaning my hands.  I suspect that the inflection above 190W is totally legit. Based on this data, I could try to train at 190W, but I suspect that this would be a bit too intense.  I did this test after a full rest day, and late in the afternoon (my best time of day).  The temp was warm, but cooling down during the session.

9-11

I had plenty of time to think, and one of the things that occurred to me is that it is entirely plausible that it takes me 30 minutes to really warmup for a steady state session.  Some of my best results a couple of seasons ago were when I eased into the first 20 minute session by starting at a lower power and then hitting target power for the second 20 minute piece.  When I did that, I think I was able to hold higher “watts at 2.0 lactate”.  I think I might make that my standard procedure over the winter.

So, 185W will be my training power for now.  Next weekend, I think I will do a 90 minute session at 185W and do lactate tests every 10 minutes to see what happens.  The hypothesis I am testing is that my lactate will initially rise toward 2.0, then fall back toward 1.0, hitting a trough around 40 minutes, and then start to rise again after 60 minutes.