3 x 5K at r20 (155 cap)

It’s time to get serious about marathon training.  To do that, I need to rebuild my base aerobic fitness, and do some of the initial tests to set a baseline for paces.

I strongly believe that aerobic work is most effective when you limit the intensity and build duration, so this week I am going to focus on 60 to 80 minute sessions.  Then next week, I will do some baseline tests.  I am not in the mood to do lactate testing right now, so I am going to try to use strict HR limits for these sessions.  I’m going to row the sessions below 80% HRR (157).  It is probably even better to row them below 75% HRR (150), but that is just so disappointingly slow.

The other thing that I am going to work on is a lighter stroke.  I have been pursuing the 10W per stroke as a goal for a while and I think I am in a bit of rut.  When I rate up, I can’t seem to modulate power very well.  So, I think I will try to stick with r20 for the sessions this week and adjust pace by just adjusting the pressure at that rate.

So, that meant that the plan for today was:

  • 3 x 5000m
  • 1′ rests
  • initial power target ~ 180-190W
  • rate : 20 spm
  • HR cap: 155

Based on the criteria, the session went pretty well.  Of course, I wish that I was able to sustain higher power versus the cap, but that will take some time to come.  I found that I enjoyed the sensation of rowing with a “fluffier” stroke.

1-9a

The summary stats are a bit off compared to the PM.  It shows how much  the pace can vary just from a few more or less meters.

Workout Summary - media/20170109-154820-sled_2017-01-09T07-28-01ZEST.strokes.csv
--|Total|-Total-|--Avg--|-Avg-|Avg-|-Avg-|-Max-|-Avg
--|Dist-|-Time--|-Pace--|-Pwr-|SPM-|-HR--|-HR--|-DPS
--|15196|65:09.0|02:08.6|179.9|20.0|149.1|159.0|11.6
W-|15005|62:09.0|02:04.3|181.6|20.0|149.3|159.0|12.1
R-|00192|03:00.0|07:47.6|083.8|21.7|143.0|159.0|01.5
Workout Details
#-|SDist|-Split-|-SPace-|-Pwr-|SPM-|AvgHR|MaxHR|DPS-
00|05000|20:27.4|02:02.7|187.0|20.0|142.8|153.0|12.2
01|05000|20:41.2|02:04.1|183.6|20.0|151.2|157.0|12.1
02|05005|21:00.9|02:06.0|174.4|20.0|153.6|159.0|11.9

A few more geeky metrics.  Here’s an plot that you can use for HR drift.  From Joe Friel’s book “Total Heart Rate Training”,

Screen Shot 2017-01-09 at 11.30.36 AM.png

So, let’s consider the first 5k as warmup time and compute drift from the second to the third interval.

183.6W/151.2bpm – 174.4/153.6bpm = 1.214 – 1.135 = 0.079 / 1.214 = 6.5% drift

Ideally, I would like to see drift well below 5% for aerobic sessions.

1-9e

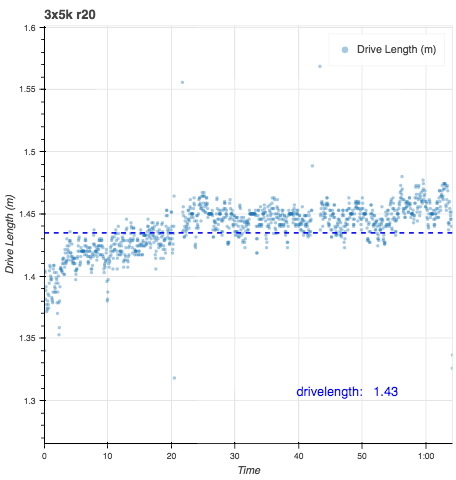
I checked drive length and it looks OK.  I see that characteristic where my drive length increases over the first 10 minutes as I loosen up.

1-9f

Since I was working on keeping the stroke the same as I eased off the pressure, I was looking for a vertical line in the work per stroke graph.  That’s what I got.

1-9d

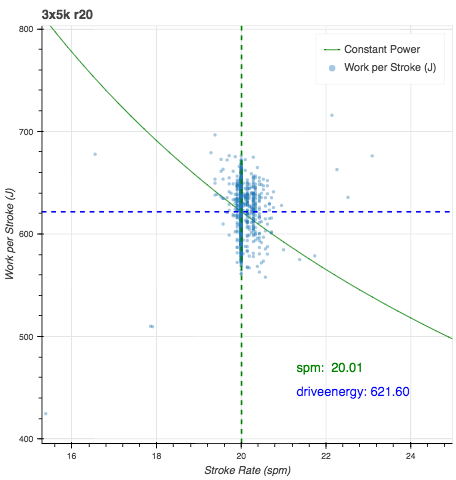
And since I eased up from 10W per stroke, I expected the peak and average power to be lower than early sessions.  Here it is compared to Saturday’s aerobic session done at 10W per stroke.  Peak force was down by about 2.5%, average force was down by 6.5%.

Tomorrow: 4 x 20′ at r20, HR limit of 150 (let’s see if I can do it!)


My knee surgery

On December 22, I had arthroscopic surgery on my right knee.  I was diagnosed with a tear in the medial meniscus cartilage.  Here’s a diagram of what that means.

torn_meniscus

The tear was diagnosed by an MRI.  Unlike the diagram, my tears appeared to on the inside edge of the cartilage, not the outside.  In addition to the meniscus tear, I was also diagnosed with osteoarthritis, which showed up as “fuzziness” in the surface cartilage in the tibia and femur in x-rays.

I was under general anesthesia for the operation which took less than an hour.  Three small incisions were made to introduce the camera, light source and surgical instruments.

Here are a couple picture of the inside of my knee showing the torn (frayed really) menicus cartilage.  The stuff that looks like fringe is the torn up inner edge of the cartilage.

There were also some pictures of the meniscus after the repair, but I didn’t manage to take photos of that.  The doctor also showed me pictures of the surface cartilage where it was degraded from the arthritis.  He said it was likely that this will potentially get worse over time, but could be treated with cortisone, simvisc and stuff like that.

I asked him if I should avoid impact sports like running.  He said that the research was inconclusive and contradictory.  He advised me to go by how the joint felt.  If it started to hurt, then avoid running.  I asked if I was OK to start rowing again and he gave me the green light for that.

After the surgery, I recovered quickly.  I was on crutches for a day.  I kept it iced during the day over the first 2 days, and it was basically immobilized with an ace bandage for four days.  After 4 days, I took off the ace bandage and changed the little bandages on the incisions daily.  I was walking a little stiffly on day 4, but gradually increased the range of motion of the knee.  By day 6, the range of motion was just about normal.  The only time I felt a twinge was walking down stairs.  I found out later that this is likely to be related to the osteoarthritis, not the meniscus and I should just get used to it.

I didn’t have any trouble with pain.  The doctor prescribed over the counter anti-inflammatory (Ibuprofen) to minimize swelling and I took that constantly for the full 10 days until the follow up appointment.  I did not need to take any of the stronger painkillers that he gave me.

And now I’m back at it.  Yesterday’s CTC session was slower than I liked, but that’s due to a lack of fitness, not a knee problem.  This morning, after rowing hard at r28, I have no knee pain or swelling.  I’m ready to call the surgery a success.


January CTC : 4 x 4′ / 4′ rest

Well, if I wanted to test how far my sprint fitness has declined, this would be a good way to do it.  Also, it would be a good way to see how well my knee works for full pressure rowing.

I figured that it would be a stretch to do this session with an average pace of 1:45.  To try to make myself a little less obsessive about the pace, I did the challenge with the watts screen up.  1:45 is just about 300W, but somehow, I figured I would do a better job backing off if I wasn’t looking at the pace sliding away.

I set up the session as a simple time interval session.  I used the first 4 minutes as a warmup with 4 power 10s close to my target pace.  Then 3 minutes of paddling.  I let the flywheel stop completely before the first interval to stay legal.

The plan was to try to hold 10W per stroke, but I found that I was having trouble getting my rating up above 28, even with the power above 300W.  I just went with it, but it sure felt like hard work.  I finished the first interval 303 watts (1:44.6).  I felt pretty toasted, but I recovered pretty well in the rest period.

I figured I should probably back off the 300w target a bit, but I set out in the second interval at 300W, but I needed to back off a bit in the second half and I ended up at 297W (1:45.6).  This one really stung and I was desperately counting down the strokes to the end.

For the third interval, I targeted 280W and I hoped that would be enough slack.  This one started pretty well, but I sure felt it in the last minute.  I beat the 280w, but just barely with 283W (1:47.3).

The last interval was going to be very difficult.  I decided to back off some more to 260W and see how it went.  I really wanted to just make it through without putting the handle down.  I did, 262W (1:50.0).

I did a progressive cool down, and then paddled enough meters to tick over 10km.

The summary graph shows that I was pushing this one close to the edge.  My max recorded HR is 185 and I matched that the last interval.

1-8a

This workout shows how using power is a better way to manage intensity for hard workouts.  HR lags power in shorter intervals, so here, you can see that I was pushing anaerobic power levels for about 14 minutes, which was the whole workout execpt for when I faded in the middle of the last interval.  By HR, it only shows 6:38.

This workout provides a good example of how the stroke based statistics of rowsandall can have errors that have a pretty big impact on shorter intervals.  I parsed the workout data to select just the 4 work intervals, and the summary data from there was.

Workout Summary - media/20170108-2130110o.csv
--|Total|-Total-|--Avg--|-Avg-|Avg-|-Avg-|-Max-|-Avg
--|Dist-|-Time--|-Pace--|-Pwr-|SPM-|-HR--|-HR--|-DPS
--|08888|40:00.0|02:15.0|193.6|24.5|157.2|185.0|09.1
W-|04476|16:00.0|01:47.2|286.4|27.1|169.8|184.0|10.3
R-|05529|32:00.0|02:53.6|129.4|22.5|149.1|184.0|06.2
Workout Details
#-|SDist|-Split-|-SPace-|-Pwr-|SPM-|AvgHR|MaxHR|DPS-
00|00004|00:00.0|00:00.0|152.6|00.0|75.0|75.0|00.0
01|01146|04:00.0|01:44.8|302.8|27.3|165.1|176.0|10.5 - +2m
02|01130|04:00.0|01:46.2|297.0|27.2|169.7|181.0|10.4 - -6m
03|01113|04:00.0|01:47.8|283.3|27.5|171.9|184.0|10.1 - -5m
04|01084|04:00.0|01:50.7|262.5|26.4|172.4|184.0|10.3 - -6m

This is close enough for analysis purposes, and to provide a good definition of work and rest strokes, but for challenges, you definitely want to use the PM directly.

Tomorrow:  10 min warmup, 40 min steady state, 10 min cool down