
I landed in Boston at 6:30am. I was on the erg by 8am. I managed to get some sleep, but my expectations for the session were pretty low.
Plan:
- 15 x 3’/1′
- Rate: 25-28
- Pace: 1:52 or better
I did this session in September (described here). The jump up was an average pace of 1:50.7, and over 9 minutes spent in the anaerobic HR band. It was brutal. Today, I was way more careful.in the way that I started, and basically negative split the workout. The end result was an average split of 1:49.9, and zero time spend in the AN band.
I think the improvement comes from both a more intelligent pacing strategy for the workout, and improved aerobic fitness since mid-September.
The plots and pictures below include 1 warmup rep and 1 cool down rep that are excluded from the pace calculations.


Here is the split summary from rowsandall.com. It looks like the way that painsled reports data, it can mess up short intervals by a few meters, so it is different from the PM picture.
Workout Summary - media/20161103-135324-sled_2016-11-03T08-06-32ZEDT.strokes.csv
--|Total|-Total-|--Avg--|Avg-|-Avg-|-Max-|-Avg
--|Dist-|-Time--|-Pace--|SPM-|-HR--|-HR--|-DPS
--|16244|68:00.0|02:05.6|24.3|155.4|178.0|09.8
W-|13610|51:00.0|01:52.4|24.4|154.9|178.0|11.0
R-|02648|17:00.0|03:12.6|22.8|161.4|178.0|03.7
Workout Details
#-|SDist|-Split-|-SPace-|SPM-|AvgHR|MaxHR|DPS-
01|00756|03:00.0|01:59.0|19.5|125.1|138.0|13.0
02|00801|03:00.0|01:52.3|24.0|140.8|151.0|11.1
03|00809|03:00.0|01:51.2|24.2|145.1|155.0|11.2
04|00814|03:00.0|01:50.6|24.3|148.4|157.0|11.2
05|00809|03:00.0|01:51.2|24.6|149.9|159.0|10.9
06|00806|03:00.0|01:51.7|24.9|152.8|162.0|10.8
07|00813|03:00.0|01:50.8|24.5|153.9|162.0|11.1
08|00805|03:00.0|01:51.7|24.7|155.0|165.0|10.9
09|00807|03:00.0|01:51.5|24.6|158.3|167.0|10.9
10|00817|03:00.0|01:50.1|24.7|160.2|169.0|11.0
11|00814|03:00.0|01:50.5|25.0|162.5|170.0|10.9
12|00811|03:00.0|01:51.0|24.8|163.0|171.0|10.9
13|00806|03:00.0|01:51.6|25.2|163.6|172.0|10.7
14|00812|03:00.0|01:50.8|25.3|164.7|173.0|10.7
15|00825|03:00.0|01:49.1|26.3|167.5|175.0|10.5
16|00827|03:00.0|01:48.8|27.6|170.4|178.0|10.0
17|00675|03:00.0|02:13.3|19.8|151.3|158.0|11.3
This session provides another opportunity to explore some of the stroke metric analysis you can do on rowsandall.com.
First, here is a view of the stroke metrics versus time.

You can see the warmup and cooldown reps. The other thing that you can just begin to see is that I got all the pace improvement in the last couple of reps by increasing rate, not force. The best place to see that is in the drv and rcv time plot, where you can see the recovery time decreasing, but the peak and average force are quite consistent with the prior reps. You can also see how my drive length increased and my avg force decreased a bit over the first few reps. Let’s dig a bit deeper into those parameters.
First, lets look at drive length over time and also versus stroke rate. I’ve used the controls on the site to exclude all rest strokes and all strokes below 23 spm, which screen out the warmup and cool down.
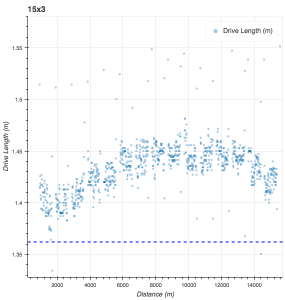

So, there is definitely a strong time dependence to my drive length. I start short, get longer as the workout continues, and only shorten up again at the end when I start to push pace much harder. The relationship between drive length and stroke rate is very weak.
Next, lets look at peak and average force.

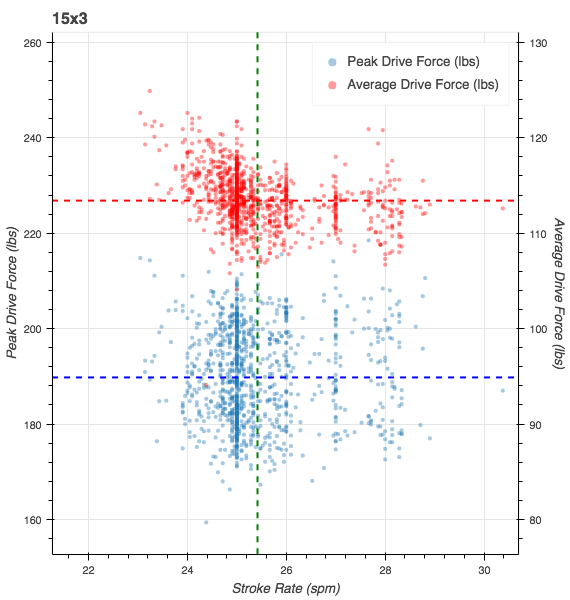
There is little change in these parameters over time or stroke rate. The area that I want to understand better is the spread of the peak power. I wonder if I am wasting energy by having an inconsistent stroke.
Tomorrow: 4 x 20′ / 1′ L4

There is a slight negative trend in the peak force vs time. It would be possible to add a linear fit to the plot for the time/distance series.
LikeLike