Look back over the last 3 months

This season has been tough.  Lot’s of work travel, family vacations, high stakes business meetings, and most recently a back injury.  I’ve been doing my best to use Stravasix to examine training load.  Here’s the past 4 months

Untitled.png

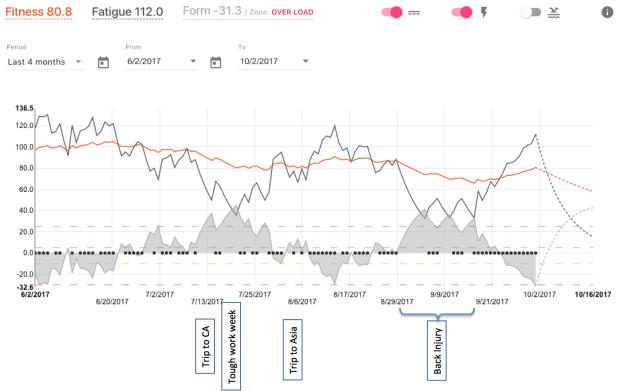
I reached my peak fitness close to the end of june, by the Stravastix scale my fitness was a 105.  After that, there was a couple of back to back trips and meetings at work that squeezed my time.  I also spent more than a week on a family vacation where my training opportunities were limited.  By July 29th, my fitness had declined to 79.

As I got into August, I was able to be a lot more consistent and my fitness started to recover, getting back to about 90 by the 22nd of August.  Then I went into another heavy week at work and my training suffered.  I came out of that week and got a few good sessions in, but then my back gave out.

Over then next few weeks, I did some walking, running and cross training, but nothing with the necessary intensity to maintain my sharpness, and nothing with enough duration to maintain my endurance.  My fitness suffered.  By the 17th of September, my fitness was down to 65.8.

The good news was that the rest, core exercise and back hygiene had worked and my back had recovered to the point where I could start rowing again.  Over the past couple of weeks, I have gotten in a lot of very solid sessions and my fitness has recovered to 81.

At this point, I have to start to be careful about over training.  My fatigue level is quite high.  The sort of good news is that I have a trip this week and will need to take at least one rest day because of that.

The thing I want to do is maximize the training stimulus during this week and next week and ramp back the following week, right before the HOCR.

After that, it will be time to take stock and figure out where I go from here.


Thursday: 15 x 3’/1′ off the red eye

I landed in Boston at 6:30am.  I was on the erg by 8am.  I managed to get some sleep, but my expectations for the session were pretty low.

Plan:

  • 15 x 3’/1′
  • Rate: 25-28
  • Pace: 1:52 or better

I did this session in September (described here).  The jump up was an average pace of 1:50.7, and over 9 minutes spent in the anaerobic HR band.  It was brutal.  Today, I was way more careful.in the way that I started, and basically negative split the workout.  The end result was an average split of 1:49.9, and zero time spend in the AN band.

I think the improvement comes from both a more intelligent pacing strategy for the workout, and improved aerobic fitness since mid-September.

The plots and pictures below include 1 warmup rep and 1 cool down rep that are excluded from the pace calculations.

Here is the split summary from rowsandall.com.  It looks like the way that painsled reports data, it can mess up short intervals by a few meters, so it is different from the PM picture.

Workout Summary - media/20161103-135324-sled_2016-11-03T08-06-32ZEDT.strokes.csv
--|Total|-Total-|--Avg--|Avg-|-Avg-|-Max-|-Avg
--|Dist-|-Time--|-Pace--|SPM-|-HR--|-HR--|-DPS
--|16244|68:00.0|02:05.6|24.3|155.4|178.0|09.8
W-|13610|51:00.0|01:52.4|24.4|154.9|178.0|11.0
R-|02648|17:00.0|03:12.6|22.8|161.4|178.0|03.7
Workout Details
#-|SDist|-Split-|-SPace-|SPM-|AvgHR|MaxHR|DPS-
01|00756|03:00.0|01:59.0|19.5|125.1|138.0|13.0
02|00801|03:00.0|01:52.3|24.0|140.8|151.0|11.1
03|00809|03:00.0|01:51.2|24.2|145.1|155.0|11.2
04|00814|03:00.0|01:50.6|24.3|148.4|157.0|11.2
05|00809|03:00.0|01:51.2|24.6|149.9|159.0|10.9
06|00806|03:00.0|01:51.7|24.9|152.8|162.0|10.8
07|00813|03:00.0|01:50.8|24.5|153.9|162.0|11.1
08|00805|03:00.0|01:51.7|24.7|155.0|165.0|10.9
09|00807|03:00.0|01:51.5|24.6|158.3|167.0|10.9
10|00817|03:00.0|01:50.1|24.7|160.2|169.0|11.0
11|00814|03:00.0|01:50.5|25.0|162.5|170.0|10.9
12|00811|03:00.0|01:51.0|24.8|163.0|171.0|10.9
13|00806|03:00.0|01:51.6|25.2|163.6|172.0|10.7
14|00812|03:00.0|01:50.8|25.3|164.7|173.0|10.7
15|00825|03:00.0|01:49.1|26.3|167.5|175.0|10.5
16|00827|03:00.0|01:48.8|27.6|170.4|178.0|10.0
17|00675|03:00.0|02:13.3|19.8|151.3|158.0|11.3

This session provides another opportunity to explore some of the stroke metric analysis you can do on rowsandall.com.

First, here is a view of the stroke metrics versus time.

myimage11-3d.png

You can see the warmup and cooldown reps.  The other thing that you can just begin to see is that I got all the pace improvement in the last couple of reps by increasing rate, not force.  The best place to see that is in the drv and rcv time plot, where you can see the recovery time decreasing, but the peak and average force are quite consistent with the prior reps.  You can also see how my drive length increased and my avg force decreased a bit over the first few reps.  Let’s dig a bit deeper into those parameters.

First, lets look at drive length over time and also versus stroke rate.  I’ve used the controls on the site to exclude all rest strokes and all strokes below 23 spm, which screen out the warmup and cool down.

So, there is definitely a strong time dependence to my drive length.  I start short, get longer as the workout continues, and only shorten up again at the end when I start to push pace much harder.  The relationship between drive length and stroke rate is very weak.

Next, lets look at peak and average force.

There is little change in these parameters over time or stroke rate.  The area that I want to understand better is the spread of the peak power.  I wonder if I am wasting energy by having an inconsistent stroke.

Tomorrow:  4 x 20′ / 1′ L4


Tuesday: 4 x 20′ / 1′ rest L4 (and stroke metrics)

Standard session.

10W * stroke rate as the target power

10 minute blocks

Plan:

Untitled11-1c.png

Results:  About 0.7 sec fast on pace, and just about right on strokes (+4 for the whole workout)

Workout Summary - media/20161101-131736-sled_2016-11-01T06-47-09ZEDT.strokes.csv
--|Total|-Total-|--Avg--|Avg-|-Avg-|-Max-|-Avg
--|Dist-|-Time--|-Pace--|SPM-|-HR--|-HR--|-DPS
--|19719|83:09.0|02:06.5|18.5|144.9|162.0|12.8
W-|19482|80:00.0|02:03.2|18.4|144.8|162.0|13.2
R-|00242|03:09.0|06:30.6|17.1|128.3|162.0|09.2
Workout Details
#-|SDist|-Split-|-SPace-|SPM-|AvgHR|MaxHR|DPS-
01|02382|10:00.0|02:05.9|17.0|123.7|138.0|14.0
02|02437|10:00.0|02:03.1|18.4|139.9|145.0|13.2
03|02429|10:00.0|02:03.5|18.4|139.2|145.0|13.2
04|02448|10:00.0|02:02.5|18.7|145.6|149.0|13.1
05|02447|10:00.0|02:02.6|18.8|146.0|153.0|13.0
06|02451|10:00.0|02:02.4|18.9|152.5|156.0|13.0
07|02448|10:00.0|02:02.6|18.9|153.4|159.0|13.0
08|02439|10:00.0|02:03.0|18.5|158.4|162.0|13.2

In terms of effort, it felt great through the first 40 minutes, but when I added in the little 2 minute chunks at 200W, it seemed to really bury me.  My HR climbed pretty hard in the last 30 minutes of the workout.  This is a bit harder than I want to be working in these sessions.  Next time, I will go back to just alternating 18s and 19s.

Since I have the enormous power of rowsandall.com at my finger tips, I decidedto do a bit deeper analysis of the row.  This was an L4 workout so the power and stroke rate is closely prescribed.  Here’s a view of the power versus strokes rate.

bokeh_plot-10

You can see that even though my averages were about right, that there is considerable variation in the power from stroke to stroke.  I wonder if greater consistency in applied power at each stroke rate would be a sign of better efficiency?

Here’s a view of Drive Length versus stroke rate. bokeh_plot-11

I would have thought that drive length would increase at lower stroke rates, but that is NOT what happened.  You can see that my stroke actually gets shorter as the stroke rate decreases.  I am also surprised at the variation from stroke to stroke, nearly 10 cm difference.  Maybe a more repeatable stroke would be more efficient?

Now a look at peak and average force

bokeh_plot-12

I haven’t really sorted this one out.  There is definitely a negative correlation between peak force and stroke rate, and a less pronounce relationship with average force.  The spread is the thing that has me fascinated.

Finally, work per stroke.  Basically “SPI”.  This by the design of the workout should be pretty flat.

bokeh_plot-13

And it is.  The interesting thing to me on this plot is that my consistency gets better as the rate increases.

I posted these for three reasons.

  1.  It’s the beginning of erg season and I need a new way to keep myself entertained.
  2. I would like to find ways to get faster that I have not yet explored
  3. I would like to capture a baseline for the beginning of the season.  Then in March, I can do this same workout and compare the graphs at the end of the season.

This afternoon, I am flying off to San Diego.  Tomorrow will be a fitness center session, then another endurance session on Thursday morning after I get off the red eye.

Hopefully during the flight today I can figure out what my next objectives are and begin to lay down a training plan.

Week #9 – Training Review

Date Day Workout Type mode Planned Workout Actual
9/5/16 Mon Rest 4×20′ erg
80′ LIT
9/6/16 Tue Long Intervals otw 5 x 2000 / 5′ rest r28
40′ HIT
30′ LIT
 sept CTC
17′ HIT
25′ LIT
9/7/16 Wed Steady State otw 4 x 2900 / 1′ rest r20 (HR limit 150)
75′ LIT
 as planned
75′ LIT
9/8/16 Thu Short Rest Intervals otw 5 x 20@32/10 off / 5 x 20@34/15 off / 5 x 20@36/20 off, 8′ between sets
15′ HIT
45′ LIT
4×20′ on erg
80′ LIT
9/9/16 Fri Technique UT2/UT1 otw Bungee Row first half, Steady state r20 second half
75′ LIT
Threshold OTW
5km hard plus power pieces
30′ HIT
30′ LIT
9/10/16 Sat Hard Distance otw 5.5K r30
30’HIT
30′ LIT
Rest Day
on the Cape, cleaning a deck
9/11/16 Sun long and easy erg 4 x 30′ / 1.5′ rest (lactate)
120′ LIT
 90′ step test
90’LIT
Summary  85′ HIT
375′ LIT
 47′ HIT
360′ LIT

Again, I am low on high intensity minutes, caused by 2 HIT sessions in the week instead of three.

I am surprising on track for LIT minutes, which is a bit surprising.  I didn’t do the mammoth Sunday row I had planned, but I did 4 endurance sessions instead of 3.

The plan had me at 18% HIT / 82% LIT.  This week was 12% HIT and 88% LIT.  A lot of the things that I’ve read seem to point toward a lower percentage of HIT in a polarized plan.   Given what’s been happening with my training this fall, I guess we will eventually find out if it works for me.

Using Painsled with Excel

The story goes back to rowpro.  A rowpro user (danburpee) on what was then the concept2 UK user forums invented a spreadsheet to process the csv files that rowpro can export for a workout.  This template was improved and modified over time and is a very useful tool to analyze workouts.  I started with the spreadsheet and adapted it to be used with crewnerd,  RIM, speedcoach and the yahoo fitness app.  When I found out that someone was creating an app for the iphone (and android i guess) that allowed one to log data from the PM3 and PM4 (via USB) or PM5 (via BT), I thought I needed to give it a try.  The app is called Painsled and it is still in beta, but is quite functional as far as I can see.

Right now the app is a bit primitive.  It essentially just logs data from the PM and stores it.  Then that data can be exported as tcx, json, or csv files.  Getting the data off the iphone requires you to plug into itunes and move files to your computer, but I imagine that this will be improved in the future.

I did some workouts with the app and exported the CSV and took a look at what you get.  It’s very different from the exports from the other  tools in a number of ways.

  1.  There is essentially a record for each “event” that comes from the PM.  So, every update of HR, or change of stroke state generates a record in the file
  2. Not all the parameters are logged in each record
  3. There are 31 (31!) fields of data

The result of this is that even short workouts generate really long csv files.  All of my tools assume that the CSV data is formatted in a more concise format.  Essentially one record per stroke, or per set distance or per set time.  Also that every field has valid data for each record.

I experimented with a couple of ideas.  I tried to read it all into excel and concatentate the data there, but because of the sheer number of rows, the performance was miserable.  It was also a pain to do what was essentially a sequential task in a programming environment that was sheet and formula based.  Ultimately I decided that I needed to preprocess the data.

I decided to make the data look as much like the export from my speedcoach as possible.  That is the excel workbook that I have done the most work on, and the file format is very straightforward.  I decided that I would tailor the workbook for painsled, but try to keep it as close as possible to the speedcoach starting point as possible.

I built a script in python called pspack2.py.  You might guess that the name means that it was my second attempt.  Actually, it is more like my fourth, but that’s not important.  I’ve posted the script here : pspack2 (apologies about posting it as PDF, apparently wordpress doesn’t like me posting text files.)

The script is straightforward.  You pass it the filename you want processed, and it does the following.

  1. Scan the file for records that indicate that the stroke state is recovery and save the indices
  2. Read each record of the file and maintain the last valid numerical value for each field.  Basically carrying the last valid value down through all the following records
  3. When you hit a record  that is a “recovery record”, write the current values for the fields to the output file.  I massaged the data field order and formatting to match the speedcoach template.

Then in the excel file, I just adjusted the axis scaling on the graphs to line up with erg splits instead of boat splits, and it worked great.  Here is the current file: Painsled Template Rev – (note:  you need to change the file extension from .xlsx to .xlsm for the file to function properly.  Also note, this works only on excel 2010 and later on windows)

This is not completely done.  There are three enhancements that I want to work on.

  1. Painsled logs distances on a per interval basis, versus accumulating like rowpro.  I will put some math in the script to change that, but it hurt my head to think it through right now.
  2. I like to look at watts, so I will add graphs  to the spreadsheet for that
  3. I want to build a time based interval text summary tab.

But, it works well enough for now and I had some fun playing with python again.

Screen Shot 2016-01-29 at 9.00.43 AMScreen Shot 2016-01-29 at 9.01.00 AM