
Back in my single, on the Upper Charles in Newton. I took that picture of a Great Blue Heron on the dock I used. I saw him as I walked back from putting my boat away. I see these birds often in the distance as I row, but this was the closest to one that I have gotten.
Weather: flat water, cool, clear skies, with the sun slowly rising during my session
Plan:
- 6 minute rate ladders.
- 3′ @ 20
- 2′ @ 22
- 1′ @ 24
- 4 x (2 x 6’/no rest) / 1′ rest (to turn the boat)
- Pace target: No real target, but I wanted to see faster paces with higher rates
- HR Target: None, but I was hoping that most of the session would be UT1. I was OK with going higher to focus on technique.
- Technique: Work on level arm draw, avoid rowing “over the barrel”. Work on crisper finishes and faster hands away.
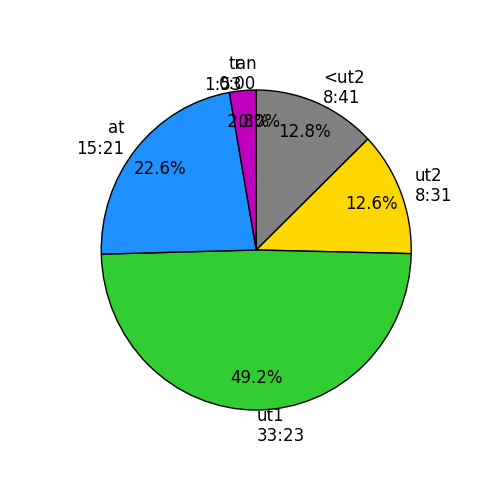
I didn’t even bother to put on the speedcoach today, I just used RIM on my phone. Here’s the data as processed by rowsandall.com. You can see that this was a bit harder work than most of my endurance sessions, with about 20 minutes above the top end of the UT1 band.

One of the cool tools that has been developed on the site is an ability to examine how different parameters in the data are related to each other. For example, in a rate ladder workout, one of the interesting relationships is pace versus stroke rate. The site also has a very useful interval editor so you can exclude strokes taken during warmup, rests and cool down. Here is a plot of pace versus stroke rate.
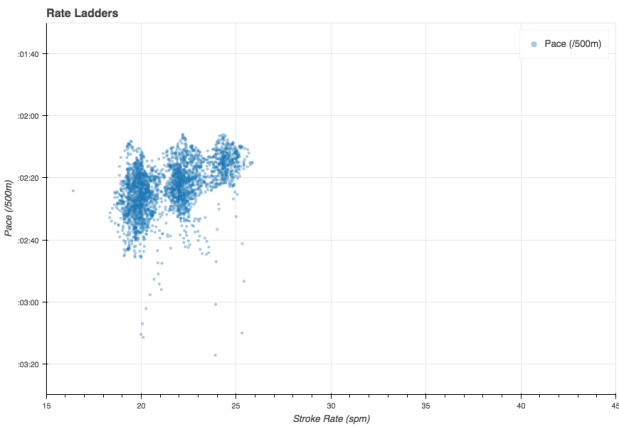
You can see from the data that there are more strokes at 20spm than 22 and 24. You can also see that there is a pretty wide variance of paces at each stroke rate. That’s totally expected because of wind, current, effort, and steering. But the interesting thing is trend of the centers of the cloud.
With the interval editor, you can also get accurate values for average pace, rate, dps and HR for each of the define intervals.
Workout Summary - media/20161024-152030-77825o.csv
--|Total|-Total-|--Avg--|Avg-|-Avg-|-Max-|-Avg
--|Dist-|-Time--|-Pace--|SPM-|-HR--|-HR--|-DPS
--|11964|62:00.0|02:35.5|20.6|148.3|167.0|09.3
W-|10087|48:00.0|02:22.8|21.4|153.9|167.0|09.8
R-|03307|22:00.0|03:19.6|18.8|142.8|167.0|07.6
Workout Details
#-|SDist|-Split-|-SPace-|SPM-|AvgHR|MaxHR|DPS-
02|02580|12:00.0|02:19.6|21.5|146.7|159.0|10.0
03|02478|12:00.0|02:25.3|21.4|154.0|162.0|09.6
04|02546|12:00.0|02:21.4|21.4|156.5|165.0|09.9
05|02483|12:00.0|02:25.0|21.5|158.5|167.0|09.6
This is pretty new functionality, so I checked it with an excel workbook that I have that does the same kind of processing.
| Tstart_ | Dist_ | Time_ | _Pace_ | SPM_ | avgHR | _DPS___ | Remarks
 | 00:00.0 | 01418 | 08:00 | 2:49.3 | 17.9 | 115.6 | 09.9 | warming up
 | 08:00.0 | 02577 | 11:59 | 2:19.5 | 21.5 | 146.7 | 10.0 | 1
 | 19:59.0 | 00108 | 01:00 | 4:37.8 | 20.4 | 149.2 | 05.3 |
 | 20:59.0 | 02479 | 12:00 | 2:25.2 | 21.4 | 154.0 | 09.6 | 2
 | 32:59.0 | 00107 | 01:00 | 4:40.4 | 21.5 | 153.4 | 05.0 |
 | 33:59.0 | 02549 | 12:00 | 2:21.2 | 21.4 | 156.5 | 09.9 | 3
 | 45:59.0 | 00086 | 01:00 | 5:48.8 | 20.7 | 152.5 | 04.2 |
 | 46:59.0 | 02487 | 12:01 | 2:25.0 | 21.5 | 158.4 | 09.6 | 4
 | 59:00.0 | 01456 | 08:00 | 2:44.8 | 18.8 | 146.1 | 09.7 | cool down

| Tstart_ | Dist_ | Time_ | _Pace_ | SPM_ | avgHR | _DPS___ | Remarks
 | 00:00.0 | 01418 | 08:00 | 2:49.3 | 17.9 | 115.6 | 09.9 | warmup
 | 00:00.0 | 00301 | 03:00 | 4:59.0 | 20.8 | 151.7 | 04.8 | rest
 | 00:00.0 | 01456 | 08:00 | 2:44.8 | 18.8 | 146.1 | 09.7 | cool down
 | 00:00.0 | 10092 | 48:00 | 2:22.7 | 21.4 | 153.9 | 09.8 | Main set
It looks like it matches up really well. In order to do similar analysis to the SPM vs pace with a spreadsheet, I need to slice the data into little mini intervals, one for each stroke rate and summarize it that way. Here’s what that looks like.
| Tstart_ | Dist_ | Time_ | _Pace_ | SPM_ | avgHR | _DPS___ | Remarks
 | 00:00.0 | 01418 | 08:00 | 2:49.3 | 17.9 | 115.6 | 09.9 | warming up
 | 08:00.0 | 00638 | 03:00 | 2:21.1 | 20.1 | 138.4 | 10.6 | r20
 | 11:00.0 | 00427 | 01:59 | 2:19.3 | 22.3 | 145.7 | 09.7 | r22
 | 12:59.0 | 00224 | 01:01 | 2:16.2 | 24.2 | 150.8 | 09.1 | r24
 | 14:00.0 | 00626 | 02:59 | 2:23.0 | 19.8 | 147.5 | 10.6 | r20
 | 16:59.0 | 00443 | 02:01 | 2:16.6 | 22.6 | 151.6 | 09.7 | r22
 | 19:00.0 | 00219 | 00:59 | 2:14.7 | 23.8 | 157.3 | 09.4 | r24
 | 19:59.0 | 00108 | 01:00 | 4:37.8 | 20.4 | 149.2 | 05.3 | turn
 | 20:59.0 | 00625 | 03:01 | 2:24.8 | 20.3 | 147.8 | 10.2 | r20
 | 24:00.0 | 00414 | 01:59 | 2:23.7 | 22.2 | 155.2 | 09.4 | r22
 | 25:59.0 | 00220 | 01:01 | 2:18.6 | 23.2 | 158.4 | 09.3 | r24
 | 27:00.0 | 00594 | 03:00 | 2:31.5 | 20.0 | 153.5 | 09.9 | r20
 | 30:00.0 | 00417 | 02:00 | 2:23.9 | 22.4 | 157.3 | 09.3 | r22
 | 32:00.0 | 00209 | 00:59 | 2:21.1 | 23.9 | 161.3 | 08.9 | r24
 | 32:59.0 | 00107 | 01:00 | 4:40.4 | 21.5 | 153.4 | 05.0 | turn
 | 33:59.0 | 00637 | 03:00 | 2:21.3 | 19.9 | 149.9 | 10.7 | r20
 | 36:59.0 | 00418 | 02:00 | 2:23.5 | 22.3 | 157.2 | 09.4 | r22
 | 38:59.0 | 00226 | 01:01 | 2:15.0 | 23.5 | 161.2 | 09.5 | r24
 | 40:00.0 | 00615 | 03:00 | 2:26.3 | 19.9 | 156.6 | 10.3 | r20
 | 43:00.0 | 00437 | 02:00 | 2:17.3 | 22.5 | 159.2 | 09.7 | r22
 | 45:00.0 | 00216 | 00:59 | 2:16.6 | 24.8 | 164.0 | 08.9 | r24
 | 45:59.0 | 00086 | 01:00 | 5:48.8 | 20.7 | 152.5 | 04.2 | turn
 | 46:59.0 | 00613 | 03:00 | 2:26.8 | 20.3 | 152.9 | 10.1 | r20
 | 49:59.0 | 00419 | 02:00 | 2:23.2 | 22.3 | 159.2 | 09.4 | r22
 | 51:59.0 | 00222 | 01:01 | 2:17.4 | 23.3 | 162.3 | 09.4 | r24
 | 53:00.0 | 00593 | 03:00 | 2:31.8 | 19.8 | 157.7 | 10.0 | r20
 | 56:00.0 | 00419 | 01:59 | 2:22.0 | 22.5 | 161.4 | 09.4 | r22
 | 57:59.0 | 00221 | 01:01 | 2:18.0 | 24.8 | 165.9 | 08.8 | r24
 | 59:00.0 | 01456 | 08:00 | 2:44.8 | 18.8 | 146.1 | 09.7 | cool down

| Tstart_ | Dist_ | Time_ | _Pace_ | SPM_ | avgHR | _DPS___ | Remarks
 | 00:00.0 | 01418 | 08:00 | 2:49.3 | 17.9 | 115.6 | 09.9 | warmup
 | 00:00.0 | 00301 | 03:00 | 4:59.0 | 20.8 | 151.7 | 04.8 | rest
 | 00:00.0 | 01456 | 08:00 | 2:44.8 | 18.8 | 146.1 | 09.7 | cool down
 | 00:00.0 | 04941 | 24:00 | 2:25.7 | 20.0 | 150.5 | 10.3 | r20
 | 00:00.0 | 03394 | 15:58 | 2:21.1 | 22.4 | 155.9 | 09.5 | r22
 | 00:00.0 | 01757 | 08:02 | 2:17.2 | 23.9 | 160.1 | 09.1 | r24
Looking at the average paces, compared to the SPM vs pace plot, it appears that the 20 and 22 spm averages line up pretty well with the visual center of the data point clouds. For 24 spm, it looks like the average is a bit slower than the center of the cloud.
Anyway, it was an amusing way to look at the data. And it was a very fun workout.
Tomorrow: The schedule calls for 5 x 1500m / 5′ rest. Who am I to argue with that. Pace target is 2:15.

The data cloud plots of course ignore the time, so if you were supposed to do 20spm, but a few strokes slipped in at 24spm, you’re going to see them in the 24spm cloud.
I actually enjoy staring at these plots for the steady state workouts.
LikeLike
Needs more data!
Wow! You guys are really going to town on the methods of data display.
LikeLiked by 1 person
You should try Sander’s site. It’s pretty cool.
LikeLike