I was really tired on Friday night, so I decided to sleep in instead of rowing on Saturday morning. I needed the sleep, all 12 hours of it!
After running around, doing errands, I decided to do an erg session in the late afternoon. I had not eaten since 9AM, and I started around 4PM, so I was reasonably fasted. I wanted to duplicate my situation rowing in the mornings as closely as I could.
I wanted to get a better feeling for what my lactate and HR did in a longer session at constant power. I’ve been doing steady state sessions around 190W and I thought that was reasonably close to a 2.0 mmol/l intensity. So, the experiment design was simple.
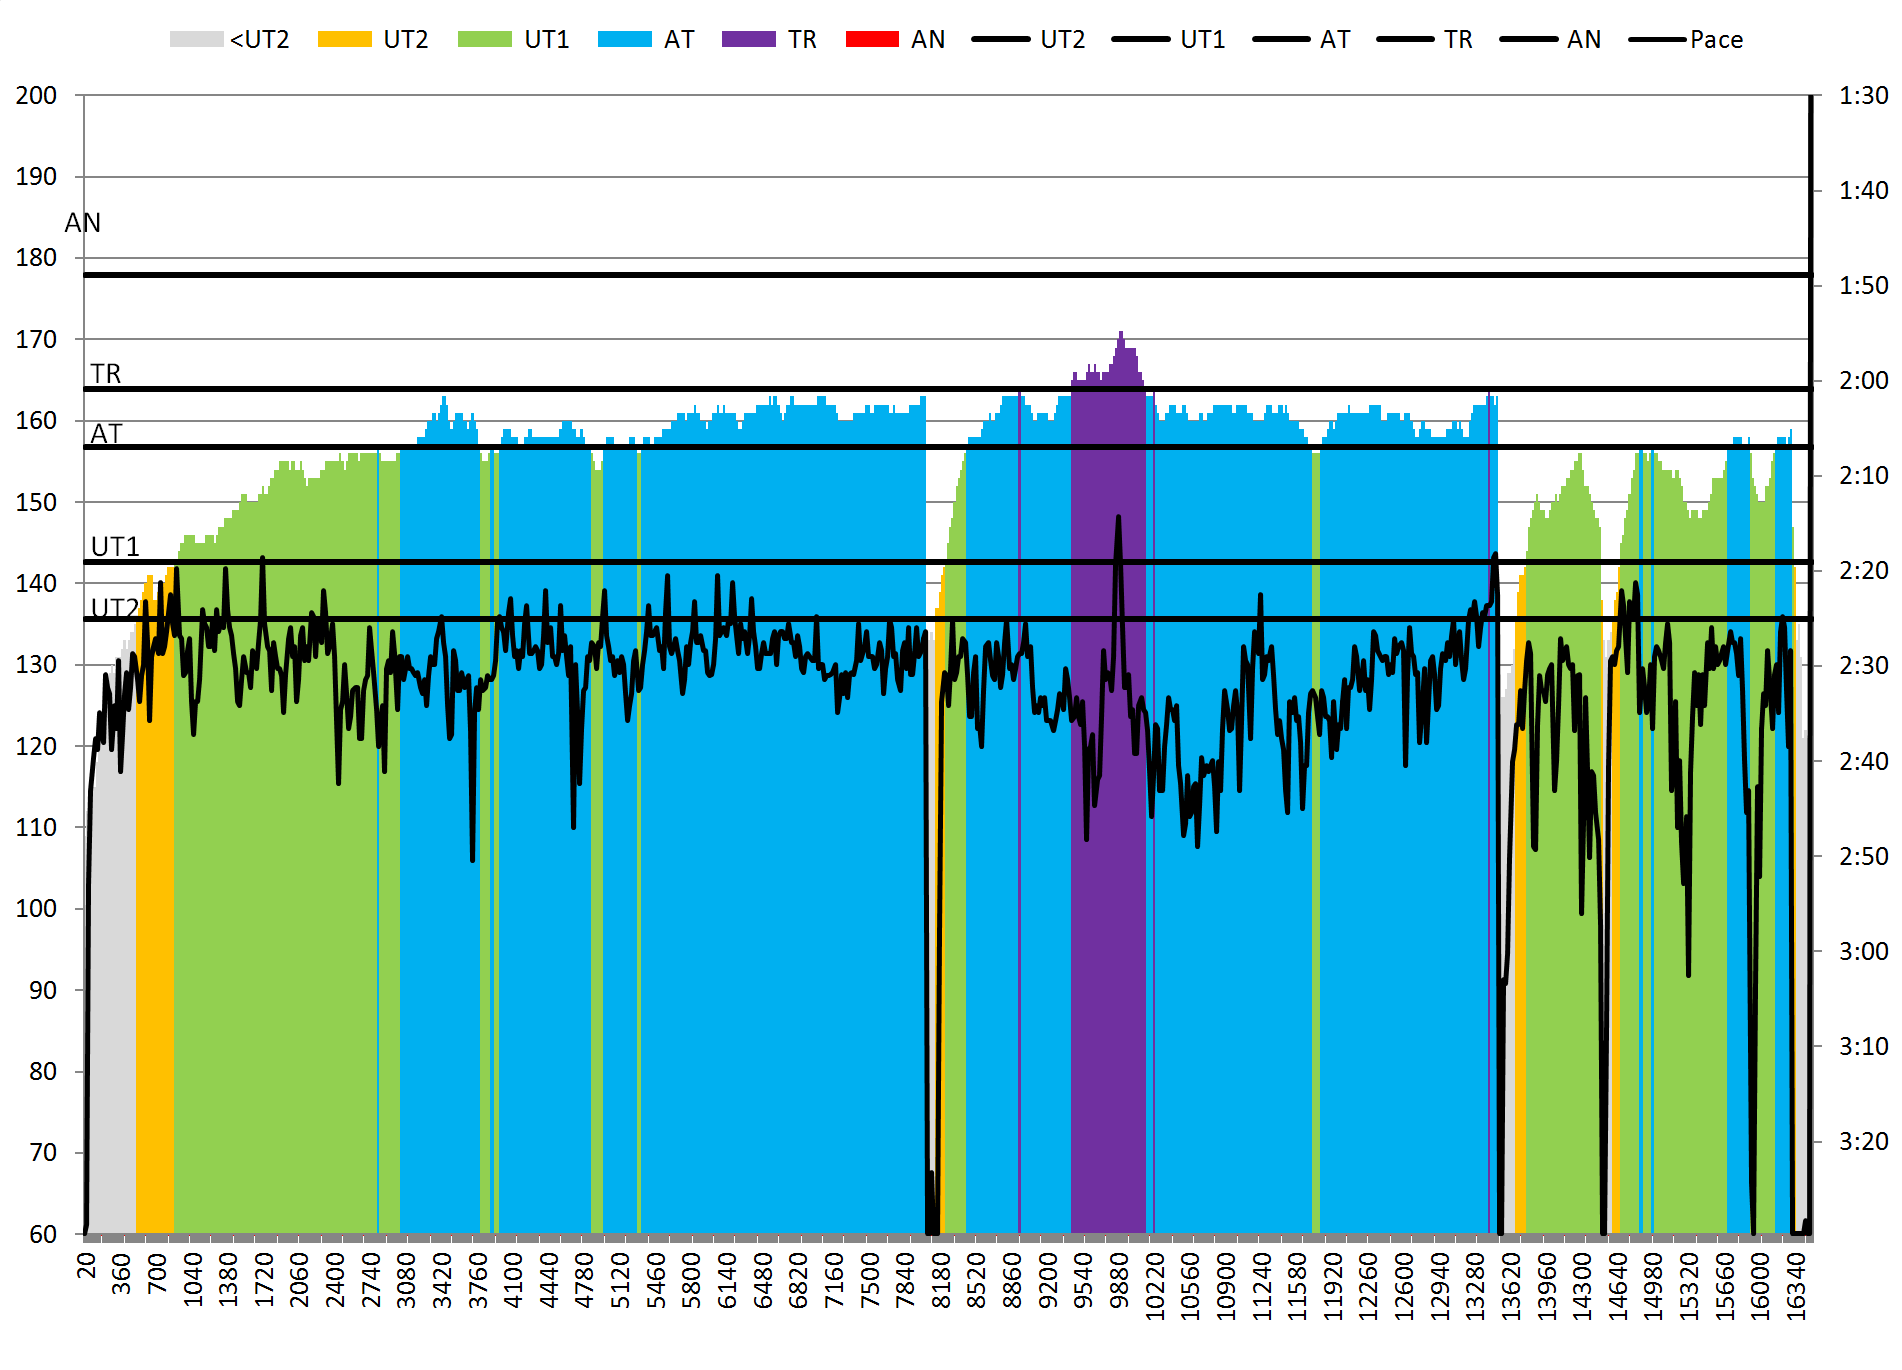
Row a sequence of 9 – 10 minute pieces at 190W, and measure lactate after each during a 1:30 rest. Here is the RowPro view of the experiment


And the split data:
Output
Workout Summary – Sep 13, 2015
–_|_Total_|_-Total-_|_–Avg–_|_-Avg-_|_Avg-_|_-Avg-_|_–Avg–_|_-Avg_|_-Avg
–_|_Dist-_|_-Time–_|_-Pace–_|_Watts_|_SPM-_|_-HR–_|_-%HRR–_|_-DPS_|_-SPI
–_|_19862_|_90:24.0_|_02:16.5_|_137.5_|_17.9_|_145.8_|_ 72.2% _|_12.2_|_07.7
Workout Details
#-_|_SDist_|_-Split-_|_-SPace-_|_Watts_|_SPM-_|_AvgHR_|_Avg%HRR_|_DPS-_|_-SPI
01_|_02450_|_10:00.0_|_02:02.4_|_190.7_|_19.5_|_129.2_|_ 60.5% _|_12.6_|_09.8
02_|_00049_|_01:30.0_|_15:22.2_|_000.4_|_02.7_|_116.3_|_ 51.2% _|_12.2_|_00.2
03_|_02453_|_10:00.0_|_02:02.3_|_191.4_|_20.0_|_135.2_|_ 64.7% _|_12.3_|_09.6
04_|_00038_|_01:30.0_|_19:59.2_|_000.2_|_02.0_|_130.0_|_ 61.0% _|_12.5_|_00.1
05_|_02451_|_10:00.0_|_02:02.4_|_190.9_|_19.9_|_141.6_|_ 69.2% _|_12.3_|_09.6
06_|_00057_|_01:30.0_|_13:03.5_|_000.7_|_03.3_|_125.2_|_ 57.6% _|_11.5_|_00.2
07_|_02450_|_10:00.0_|_02:02.4_|_190.7_|_19.8_|_144.9_|_ 71.5% _|_12.4_|_09.6
08_|_00055_|_01:30.0_|_13:33.1_|_000.7_|_04.0_|_125.2_|_ 57.6% _|_09.2_|_00.2
09_|_02451_|_10:00.0_|_02:02.4_|_191.0_|_20.0_|_147.7_|_ 73.6% _|_12.3_|_09.5
10_|_00043_|_01:30.0_|_17:23.5_|_000.3_|_02.7_|_135.3_|_ 64.7% _|_10.8_|_00.1
11_|_02453_|_10:00.0_|_02:02.3_|_191.3_|_20.3_|_152.0_|_ 76.6% _|_12.1_|_09.4
12_|_00038_|_01:33.0_|_20:28.0_|_000.2_|_01.9_|_147.3_|_ 73.3% _|_12.6_|_00.1
13_|_02458_|_10:00.0_|_02:02.1_|_192.5_|_20.2_|_157.3_|_ 80.4% _|_12.2_|_09.5
14_|_00032_|_01:33.0_|_24:08.3_|_000.1_|_01.3_|_146.0_|_ 72.3% _|_16.1_|_00.1
15_|_02383_|_09:48.0_|_02:03.4_|_186.3_|_20.2_|_160.3_|_ 82.5% _|_12.0_|_09.2
This resulted in the following data:

Which, when graphed, looks like:

So, what does this mean?
- 190W is too high of a power level for me right now.
- My HR takes a while to work it’s way up, but the lactate tracks effort pretty quickly
- My endurance is suspect. The plateau from 20 to 30 is interesting. I was able to hold that for that period, but I guess I fatigued and started to rely on more fast twitch muscles, which started to generate more lactate. That’s also the point in the row where it started to feel like work.
- I was still in my UT1 band until after 60 minutes of rowing, but my lactates were way above the 2.0mmol/l target. My rule of thumb of keeping it below the top end of UT1 is NOT a good guideline.
This was valuable enough that I think I will try it again next weekend at 185W. I suspect that the plateau will be lower and longer, but will break free again and start to climb.