Sunday: HM (I guess it was an L3 workout)

I’ve been reading all these posts about people doing the Crazy Bear Challenge.  This challenge is to row 30 Half marathons in the 45 days between November 11 and Christmas.  I’m tempted to join in, even though it doesn’t make perfect sense with my training objectives.

Anyway, I wanted to have a little fun today, so I thought I would do a Half Marathon and target a pace just under 2:00.   That seemed like a respectable place to start.

It turned out to be reasonably easy, all but the last 15 minutes or so were UT1 or below. And this result put at 25th in the rankings.  I might do some more of these and gradually psh the pace a bit faster.

One of the fun things you can do with rowsandall.com is to arbitrarily assign new split lengths.  On the PM5, I used 2000m splits.  On rowsandall, I split the row into 1000m segments.  Looks pretty darn consistent.

Workout Summary - media/20161114-021734-sled_2016-11-13T17-25-38ZEST.strokes.csv
--|Total|-Total-|--Avg--|Avg-|-Avg-|-Max-|-Avg
--|Dist-|-Time--|-Pace--|SPM-|-HR--|-HR--|-DPS
--|21097|83:29.0|01:58.7|22.1|149.4|161.0|11.4
W-|21097|83:31.0|01:58.8|22.1|149.3|161.0|11.4
R-|00000|00:00.0|00:00.0|00.0|000.0|161.0|00.0
Workout Details
#-|SDist|-Split-|-SPace-|SPM-|AvgHR|MaxHR|DPS-
01|01000|03:55.0|01:57.5|20.8|130.2|140.0|12.3
02|01000|03:57.8|01:58.9|21.1|140.0|142.0|12.0
03|01000|03:57.8|01:58.9|21.7|141.5|144.0|11.6
04|01000|03:57.3|01:58.7|21.8|143.3|146.0|11.6
05|01000|03:58.1|01:59.1|21.9|142.8|145.0|11.5
06|01000|03:57.8|01:58.9|22.0|144.1|148.0|11.5
07|01000|03:57.3|01:58.7|22.0|145.7|148.0|11.5
08|01000|03:57.5|01:58.7|22.1|147.1|150.0|11.4
09|01000|03:57.5|01:58.8|22.2|148.9|151.0|11.4
10|01000|03:57.8|01:58.9|22.1|150.0|152.0|11.4
11|01000|03:57.6|01:58.8|22.0|150.6|152.0|11.5
12|01000|03:57.5|01:58.7|22.3|151.4|154.0|11.4
13|01000|03:57.7|01:58.9|22.6|151.3|153.0|11.2
14|01000|03:57.6|01:58.8|22.2|153.0|155.0|11.4
15|01000|03:57.3|01:58.7|22.3|153.5|155.0|11.3
16|01000|03:58.0|01:59.0|22.3|154.8|157.0|11.3
17|01000|03:57.7|01:58.8|22.2|155.2|156.0|11.4
18|01000|03:58.1|01:59.0|22.4|156.4|157.0|11.3
19|01000|03:57.7|01:58.8|22.7|157.2|159.0|11.1
20|01000|03:57.5|01:58.8|22.6|158.5|161.0|11.2
21|01000|03:57.3|01:58.6|22.9|158.5|160.0|11.0
22|00097|00:23.0|01:58.8|22.9|157.4|158.0|11.0

myimage11-13a

Another magical afternoon row.  I am sure that I could do at least 1 split faster, maybe more.


Friday: 4 x 20 L4

Thursday was a “rest day”.  Up at 5am to fly home. Driving home from the airport sucked, nearly 2 hours in traffic.

I decided a good night sleep was needed and made the call to work from home.  That made my morning a lot easier.  I woke up at 8:30, had breakfast and was in a meeting at 9.

I worked until around 3:30 and then decided it was time for some training.

Plan:

  • 4 x 20′ / 1′ rests
  • L4 format
  • Start slow, then push it a little harder than last weekend
  • 10W per stroke

Having a little issue with the interval editor, so no details on each 10 minute segment.

Lactate test at the end, after 80 minutes, 2.0mmol/l – right on the nose.

One other note.  It was nice and cold.  57F when I finished.

I think the key thing that I noticed is that my HR was following the power very closely.  I think that is the key for me, if I start to see more decoupling between HR and power, then I am pushing the session too hard.

By the way, I had a blast with the stroke sequence today.

Untitled11-11d.png


Wednesday: 40′ endurance and a little strength training

In Agoura Hills, California.  At the Sheraton fitness center.

Seemed like today was as good a day as any to start doing a little bit of strength training.

Plan:

  • 20 minutes inclined march (15% grade, 3.5mph)
  • 20 minute jog (3% grade, 4.5 mph)
  • HR cap at 157
  • Easy start to strength training
    • Dumbell deadlifts (2x50lbs) – 3 sets of 10 reps
    • Lat pull down (110lbs) – 2 sets of 6 reps plus one set of 8
    • Push ups – 3 sets of 10 reps

Another bad workout after another bad night’s sleep.  The election debacle kept me tossing and turning even after I turned off the TV.

Tomorrow:  No workout.  Flying back home.


Tuesday: 3 x 20′ L4 at Fitness Evolution

In San Jose.  My hotel had a deal with the gym across the road.  By some miracle, it had a half dozen well maintained Model D rowers with PM5s.

Plan was to do 4×20 L4, but once I got going, I found that I was working very hard to go very slowly.  I cut it short after an hour.

Here is the row versus time, with pie charts for HR and power.

Compare this to Sunday’s row.  Longer row, higher power, lower Heart rate.

Why the difference:

  • Time of day:  I do better in the afternoon.  Tuesday’s row was at 5:30am.
  • Rest:  I did not sleep well.  I spent 6 hours on a plane on Monday
  • Nutrition:  I had 2 beers the night before the Tuesday Row.  I think that hurts a bit.
  • Environment: Sunday was with a fan and the windows open.  It was 61F in the room when I finished.  Tuesday was in a corner of the club with no airflow.  I left big puddles.

It’s still an impressive difference.  Another reason to use RPE as the guiding principle for endurance intensity.


Monday: 4 x 2800m Threshold OTW

In Newton in my Fluid

Weather:  36F, Clear, light wind from the NNW 3-5mph.  This was a head wind heading down river.  It was only a factor in the straight section in front of the watch factory.

Plan:

  • 4 x 2800m
  • 3-5min rest
  • Rate: 24-26
  • Pace: ~2:15
  • HR Cap: None –> Target TR zone
  • Technique:  Clean Finishes.

Screen Shot 2016-11-07 at 9.55.57 AM.png

Workout Summary - media/20161107-143843-78581o.csv
--|Total|-Total-|--Avg--|Avg-|-Avg-|-Max-|-Avg
--|Dist-|-Time--|-Pace--|SPM-|-HR--|-HR--|-DPS
--|13608|71:23.0|02:37.4|23.1|150.5|170.0|08.2
W-|11198|51:40.0|02:18.4|24.8|160.0|170.0|08.7
R-|03680|27:30.0|03:44.3|19.1|123.4|170.0|07.9
Workout Details
#-|SDist|-Split-|-SPace-|SPM-|AvgHR|MaxHR|DPS-
02|02820|12:55.7|02:17.5|25.1|158.4|164.0|08.7
03|02804|12:46.9|02:16.8|24.7|160.1|166.0|08.9
04|02753|13:05.1|02:22.6|24.5|160.9|166.0|08.6
05|02821|12:52.3|02:16.9|24.9|160.4|170.0|08.8

A very good workout.  I pushed hard, but tried to stick to r24, and that kept the HR in a reasonable place.  I wanted to focus more on rowing clean than driving for the best possible pace.

The one interesting thing from the workout is the sharp deceleration at 6000m.  I was going through the s-turn and a goose did not get out of my way quickly enough.  I hit it hard with my oar during recovery, and lost my grip on the handle.  Luckily, the force of the “bird strike” pushed the handle toward my torso.  It was trapped between my leg and chest and I could grab it again quickly.  Good thing too, because the blade was flipping from feathered to square and starting to really catch water.  I think I avoided a flip by a fraction of a second.  Usually the geese are smart enough to get out of my way.  I think this specific goose will probably do so in the future.

Here’s a quick look at stroke metrics.

bokeh_plot-31The loop down to 20 spm at the bottom is my “bird strike”.

I did a plot of each interval to see if I could see the effect of the light headwind.  The left column is against the headwind, the right column is with the wind.

Now I am off to San Jose and LA for the week.  I will probably stick to cross training at hotel gyms for this trip.  Maybe try to do a couple of strength sessions.

Saturday: Bumpy 14km Open Water Row

Down in Wellfleet.  I saw that the weather forecast looked good.  Sunny, calm, but a bit chilly (in the mid 40s).  I decided to go for a last Open Water row of the season.

The wind forecast proved to be wrong.  Right before I launched, it felt like the wind was freshening and it definitely was kicking up some waves.  Here’s the weather data from the station on my house.

Screen Shot 2016-11-05 at 1.52.20 PM.png

I launched at 11:07, according to RIM, and on top of my house it was blowing nearly 20mph then.  It didn’t feel like it was blowing quite as hard as that.  I think the fact that my wind sensor is about 80 feet above sea level means that it is catching a bit more wind than I was seeing on the water.  It was still pretty breezy though.

I didn’t check before I set out, but the water temperature was 55F.  When the air temp is in the 40s, this actually doesn’t feel too bad.  And for those safety sticklers, I passed the “100 degree rule” by a degree.  46F (air) + 55F (water) = 101!  But I think this will be it for open water rowing this year.  The margin for error is pretty slim at these temperatures.

Since it was cold out, I brought a towel and socks.  After I launched from the beach, I dried my feet and put on the nice dry socks.  That lasted about 2 minutes before the waves came crashing into the cockpit and soaked my feet.  The waves kept building and I decided to head pretty much straight up wind to get across the harbor over to the long sand spit on the far side, where I figure the water would be a lot flatter.

Rowing into the waves was slow, but not hard.  There is a regular pattern to the waves and you can get used to rowing in time time with them.  The key thing is to be very deliberate about placing the blades at the catch, and then load up the drive gradually, since there is a good chance that one blade or the other will miss water due to the waves.  If you have a habit of rowing in, this would sure help cure it.

I made it about 1500m before a wave managed to fool my phone into thinking that I was doing a whole lot of screen touching.  Over about 500m of rowing, the splashing did the following:

  • Went to the RIM setup screen
  • quit out of RIM
  • popped back to the home screen
  • started up Spotify
  • picked a playlist
  • and, I swear to God, pushed play.

As I approached the spit, the chop subsided.  I was still a couple hundred meters off shore, but when I looked over my shoulder, I saw a couple of big rocks poking up maybe 50 meters ahead.  I decided it was probably a good time to turn north and row along the lee shore of the spit.  I stopped briefly and stopped the music, fired up Wahoo fitness.  I decided to do that because I know that it works in background with the screen off.  So once it was started, I turned off the screen and just rowed by feel.  It was pretty enjoyable rowing unplugged like that.  Even in the lee of the spit, there was still a bit of chop and it really was trying to push my bow around when I was rowing north.  I needed to maintain a lot more pressure on my starboard oar the way along.

You can see a couple of sharpish turns as I approached the north end of the bay.  The first was when I saw the bottom rapidly shoaling on me as I approach the sand bar at the north end of the spit. I turned to the northeast to get back to deeper water.  Then you can see the unintentional turn towards the northwest which was induced by the wind and chop.  I finally noticed what was going on and turned east toward Wellfleet inner harbor.

As I rowed along, I again noticed the water shoaling under me.  You can see the area on the map, a little sandbar right after my turn to the east.  It got shallow enough that I touched bottom with one of my oars.  After that, I paddled along and the waves got a bigger as I got further from the spit.  I was rowing with the waves and it was kind of fun when I could time my stroke to catch a wave to surf down the front of (more on that later).

I continued past the wellfleet breakwater into the inner harbor and rowed all the way to the end of the town pier, when I spun.  Rowing with the wind, I was starting to feel a bit warm with all my layers and with a lack of splashing and spray.  That changed as soon as I turned back toward the west and started rowing into the wind.  The boat took a lot more effort to move, and the wind felt pretty strong and cold.  I wasn’t feeling overly warm anymore.  At that point I really appreciated the fantastic JL shell that I was wearing.

Once I cleared the end of the breakwater, I needed to turn south to head home.  This proved to be a significant challenge.  Going south meant that I had the northwest wind and waves coming at a angle to my stern.  Along this section the waves built to over 12″.  Now, I know that this does not sound all that impressive, but when the freeboard of the boat is less than 4″ and the oarlocks are about 8 inches above the water, it means that there is lot of water above the top of the boat, and maintaining control of the oars requires a bit of concentrated effort.  Also, since the waves are at an angle, you need to have vastly different handle heights at the catch to make sure that your blades are actually in the water.

The result of this was that I actually worked less hard in the section and rowed pretty slowly.  I continued south past my house to the beach where I launched and then turned for a last run straight downwind to the beach.  This was a blast!  The waves were over a foot, and now they were right on my stern.  I could get myself lined up and surf down the faces of the waves.  Over 5 feet of stern was completely submerged, and when I surged over the crest of a wave, my backstays would be slashing through the water sending spray all over.  The cockpit would fill with water.  The fun bit was trying to keep my stern to the waves, because they were trying to turn me broadside at the end of each of these surfs.  This kind of rowing bears no resemblance at all to flat water rowing.  This was all about timing your stroke to get you on the face of the wave and control the boat well enough that you can put in a single powerful stroke at the right time.  Honestly, the last 3 minutes of this section made the difficulties of the prior 30 minutes totally worthwhile.

screen-shot-2016-11-05-at-1-57-43-pm

One fun thing to point out on the map.  See the three little intervals at the very end.  That’s me carrying my oars to the car, then going back to the beach, then carrying my boat to the car over the dune.  I didn’t stop the wahoo app until I was in the car and had the phone out of it’s waterproof case.

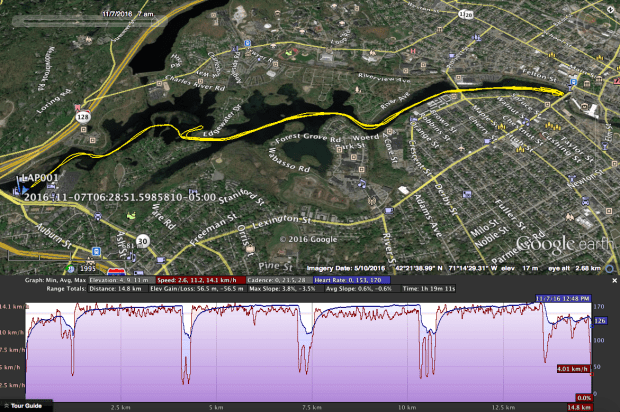
Also notice the 2000m gap at the beginning.  The first path to the west is the TCX file from RIM.  It stops when the ocean started screwing around with my phone.  The line starts again after I got the wahoo fitness app running, and started to row north along the spit.

This is the RIM data for the row across to the spit.  I estimate another 2000m basically just like that is missing.

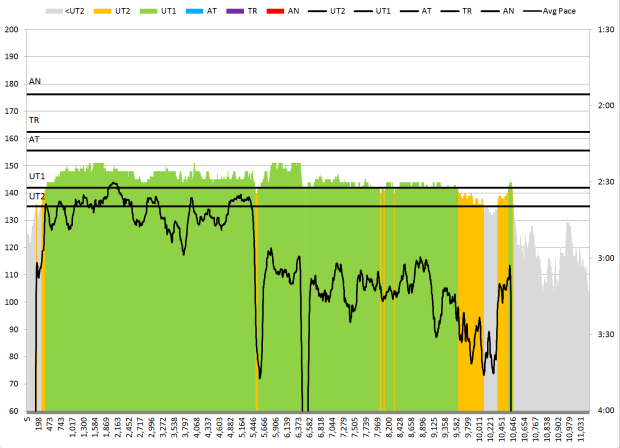
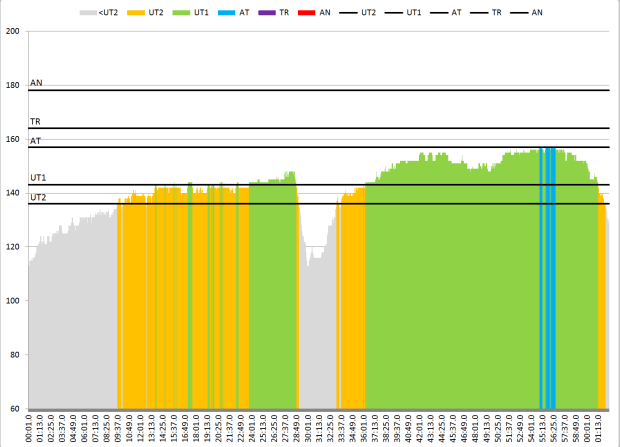
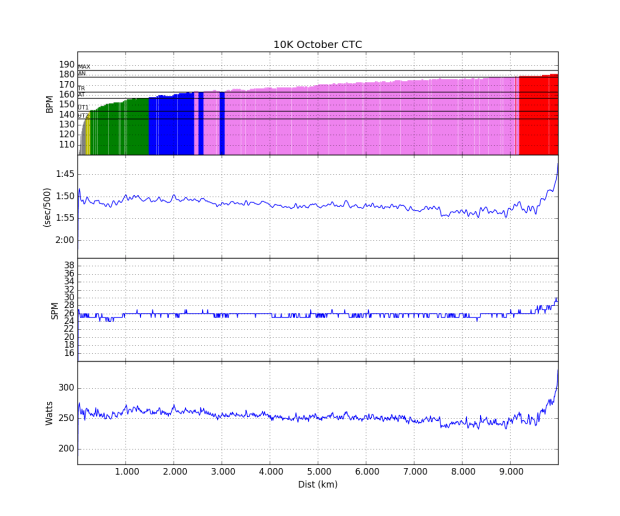
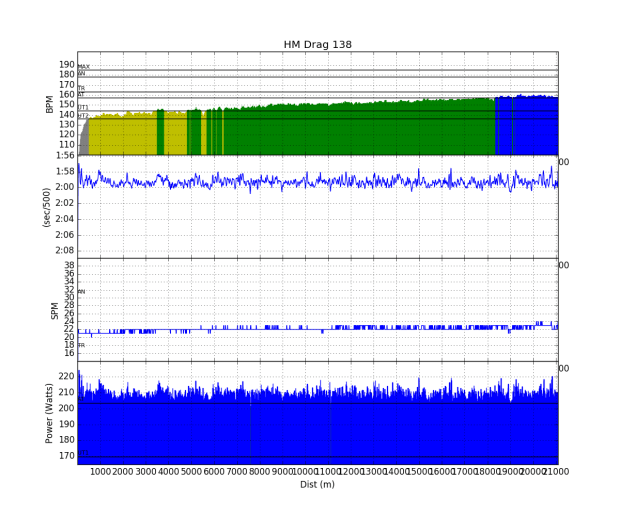
And here’s the HR and pace data for the rest of the row.  Notice the extreme difference in pace between rowing with a cross wind on flat-ish water (0 to 5000m) and rowing with a cross wind and a pretty good chop (5000m to 9000m).

From 9000m to about 10,400m was the worst wave action and I was struggling to get good strokes in.  You can see how my heart rate is dropping in this section.  I was really just trying to keep the boat on course and pick my way through the waves.  Then finally after 10,400, that was where I turned downwind and surfed to the beach.  Still not fast, but a hell of a lot of fun!

So, when you put it all together, you get

RIM:   1526m, 11:30


Guess: 2000m, 11:00

Wahoo: 10645m, 1:06:00

Total: 14171m, 1:28:30

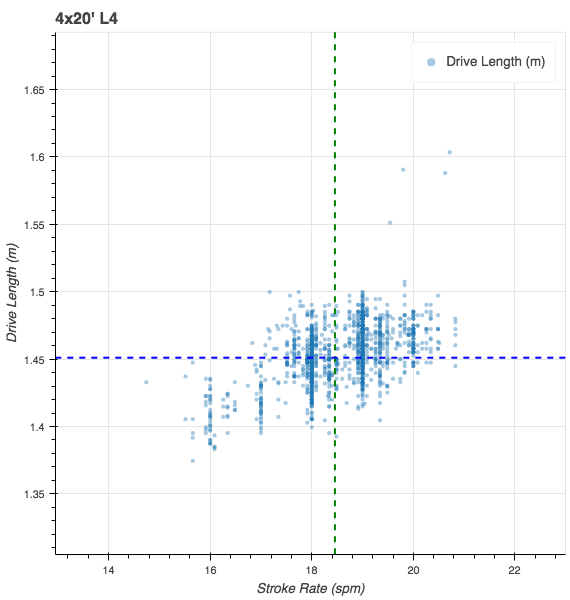
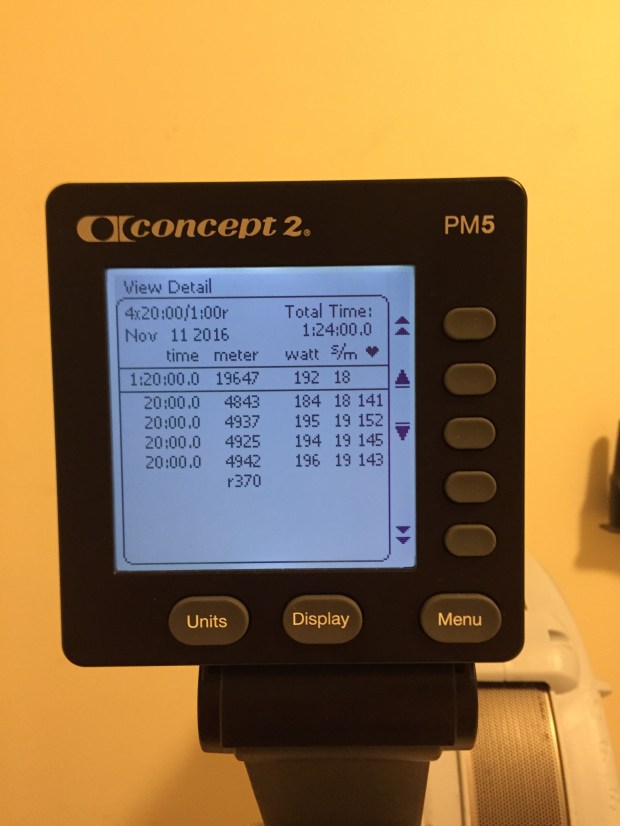
Tomorrow:  4 x 20′ or rest day, depending when we get home.
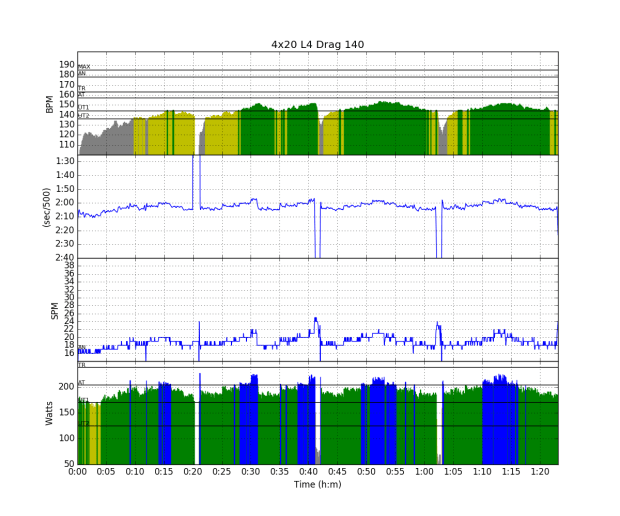
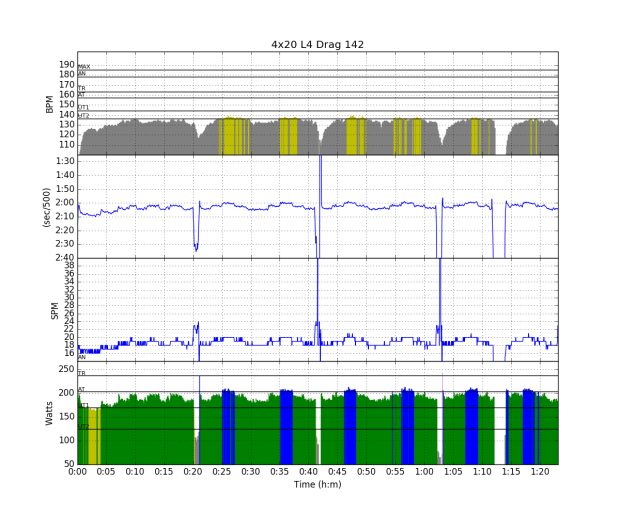
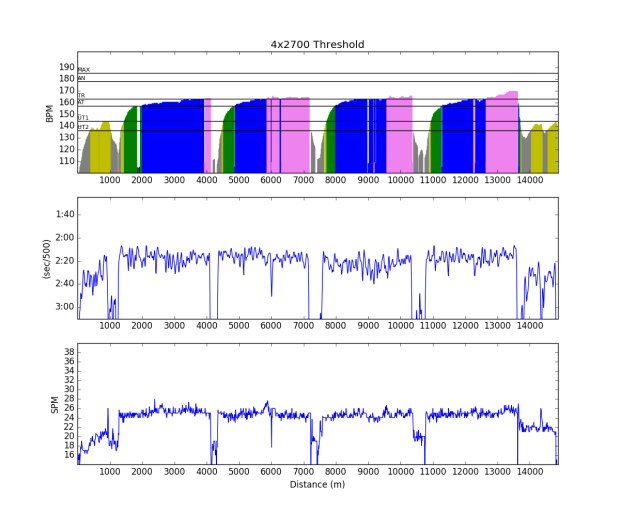
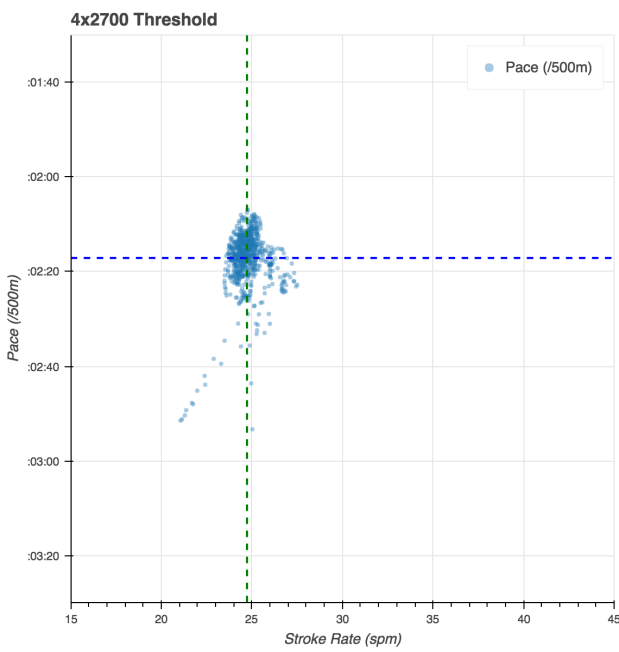
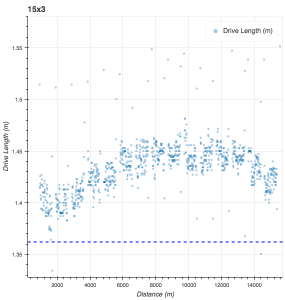
Thursday: 15 x 3’/1′ off the red eye

I landed in Boston at 6:30am.  I was on the erg by 8am.  I managed to get some sleep, but my expectations for the session were pretty low.

Plan:

  • 15 x 3’/1′
  • Rate: 25-28
  • Pace: 1:52 or better

I did this session in September (described here).  The jump up was an average pace of 1:50.7, and over 9 minutes spent in the anaerobic HR band.  It was brutal.  Today, I was way more careful.in the way that I started, and basically negative split the workout.  The end result was an average split of 1:49.9, and zero time spend in the AN band.

I think the improvement comes from both a more intelligent pacing strategy for the workout, and improved aerobic fitness since mid-September.

The plots and pictures below include 1 warmup rep and 1 cool down rep that are excluded from the pace calculations.

Here is the split summary from rowsandall.com.  It looks like the way that painsled reports data, it can mess up short intervals by a few meters, so it is different from the PM picture.

Workout Summary - media/20161103-135324-sled_2016-11-03T08-06-32ZEDT.strokes.csv
--|Total|-Total-|--Avg--|Avg-|-Avg-|-Max-|-Avg
--|Dist-|-Time--|-Pace--|SPM-|-HR--|-HR--|-DPS
--|16244|68:00.0|02:05.6|24.3|155.4|178.0|09.8
W-|13610|51:00.0|01:52.4|24.4|154.9|178.0|11.0
R-|02648|17:00.0|03:12.6|22.8|161.4|178.0|03.7
Workout Details
#-|SDist|-Split-|-SPace-|SPM-|AvgHR|MaxHR|DPS-
01|00756|03:00.0|01:59.0|19.5|125.1|138.0|13.0
02|00801|03:00.0|01:52.3|24.0|140.8|151.0|11.1
03|00809|03:00.0|01:51.2|24.2|145.1|155.0|11.2
04|00814|03:00.0|01:50.6|24.3|148.4|157.0|11.2
05|00809|03:00.0|01:51.2|24.6|149.9|159.0|10.9
06|00806|03:00.0|01:51.7|24.9|152.8|162.0|10.8
07|00813|03:00.0|01:50.8|24.5|153.9|162.0|11.1
08|00805|03:00.0|01:51.7|24.7|155.0|165.0|10.9
09|00807|03:00.0|01:51.5|24.6|158.3|167.0|10.9
10|00817|03:00.0|01:50.1|24.7|160.2|169.0|11.0
11|00814|03:00.0|01:50.5|25.0|162.5|170.0|10.9
12|00811|03:00.0|01:51.0|24.8|163.0|171.0|10.9
13|00806|03:00.0|01:51.6|25.2|163.6|172.0|10.7
14|00812|03:00.0|01:50.8|25.3|164.7|173.0|10.7
15|00825|03:00.0|01:49.1|26.3|167.5|175.0|10.5
16|00827|03:00.0|01:48.8|27.6|170.4|178.0|10.0
17|00675|03:00.0|02:13.3|19.8|151.3|158.0|11.3

This session provides another opportunity to explore some of the stroke metric analysis you can do on rowsandall.com.

First, here is a view of the stroke metrics versus time.

myimage11-3d.png

You can see the warmup and cooldown reps.  The other thing that you can just begin to see is that I got all the pace improvement in the last couple of reps by increasing rate, not force.  The best place to see that is in the drv and rcv time plot, where you can see the recovery time decreasing, but the peak and average force are quite consistent with the prior reps.  You can also see how my drive length increased and my avg force decreased a bit over the first few reps.  Let’s dig a bit deeper into those parameters.

First, lets look at drive length over time and also versus stroke rate.  I’ve used the controls on the site to exclude all rest strokes and all strokes below 23 spm, which screen out the warmup and cool down.

So, there is definitely a strong time dependence to my drive length.  I start short, get longer as the workout continues, and only shorten up again at the end when I start to push pace much harder.  The relationship between drive length and stroke rate is very weak.

Next, lets look at peak and average force.

There is little change in these parameters over time or stroke rate.  The area that I want to understand better is the spread of the peak power.  I wonder if I am wasting energy by having an inconsistent stroke.

Tomorrow:  4 x 20′ / 1′ L4


Wednesday: 2 x 30′ Fitness Center

In San Diego.  Hotel Fitness Center

  • 30 minutes treadmill, 3.1 mph, 15% incline
  • 30 minutes elliptical, level 15, “rolling hills”

As boring as it sounds.

Tonight: back on the red eye.

Tomorrow:  I should do something higher intensity.  Maybe I’ll do the 15×3’/1′ with an easy-ish pace target like 1:52.

Tuesday: 4 x 20′ / 1′ rest L4 (and stroke metrics)

Standard session.

10W * stroke rate as the target power

10 minute blocks

Plan:

Untitled11-1c.png

Results:  About 0.7 sec fast on pace, and just about right on strokes (+4 for the whole workout)

Workout Summary - media/20161101-131736-sled_2016-11-01T06-47-09ZEDT.strokes.csv
--|Total|-Total-|--Avg--|Avg-|-Avg-|-Max-|-Avg
--|Dist-|-Time--|-Pace--|SPM-|-HR--|-HR--|-DPS
--|19719|83:09.0|02:06.5|18.5|144.9|162.0|12.8
W-|19482|80:00.0|02:03.2|18.4|144.8|162.0|13.2
R-|00242|03:09.0|06:30.6|17.1|128.3|162.0|09.2
Workout Details
#-|SDist|-Split-|-SPace-|SPM-|AvgHR|MaxHR|DPS-
01|02382|10:00.0|02:05.9|17.0|123.7|138.0|14.0
02|02437|10:00.0|02:03.1|18.4|139.9|145.0|13.2
03|02429|10:00.0|02:03.5|18.4|139.2|145.0|13.2
04|02448|10:00.0|02:02.5|18.7|145.6|149.0|13.1
05|02447|10:00.0|02:02.6|18.8|146.0|153.0|13.0
06|02451|10:00.0|02:02.4|18.9|152.5|156.0|13.0
07|02448|10:00.0|02:02.6|18.9|153.4|159.0|13.0
08|02439|10:00.0|02:03.0|18.5|158.4|162.0|13.2

In terms of effort, it felt great through the first 40 minutes, but when I added in the little 2 minute chunks at 200W, it seemed to really bury me.  My HR climbed pretty hard in the last 30 minutes of the workout.  This is a bit harder than I want to be working in these sessions.  Next time, I will go back to just alternating 18s and 19s.

Since I have the enormous power of rowsandall.com at my finger tips, I decidedto do a bit deeper analysis of the row.  This was an L4 workout so the power and stroke rate is closely prescribed.  Here’s a view of the power versus strokes rate.

bokeh_plot-10

You can see that even though my averages were about right, that there is considerable variation in the power from stroke to stroke.  I wonder if greater consistency in applied power at each stroke rate would be a sign of better efficiency?

Here’s a view of Drive Length versus stroke rate. bokeh_plot-11

I would have thought that drive length would increase at lower stroke rates, but that is NOT what happened.  You can see that my stroke actually gets shorter as the stroke rate decreases.  I am also surprised at the variation from stroke to stroke, nearly 10 cm difference.  Maybe a more repeatable stroke would be more efficient?

Now a look at peak and average force

bokeh_plot-12

I haven’t really sorted this one out.  There is definitely a negative correlation between peak force and stroke rate, and a less pronounce relationship with average force.  The spread is the thing that has me fascinated.

Finally, work per stroke.  Basically “SPI”.  This by the design of the workout should be pretty flat.

bokeh_plot-13

And it is.  The interesting thing to me on this plot is that my consistency gets better as the rate increases.

I posted these for three reasons.

  1.  It’s the beginning of erg season and I need a new way to keep myself entertained.
  2. I would like to find ways to get faster that I have not yet explored
  3. I would like to capture a baseline for the beginning of the season.  Then in March, I can do this same workout and compare the graphs at the end of the season.

This afternoon, I am flying off to San Diego.  Tomorrow will be a fitness center session, then another endurance session on Thursday morning after I get off the red eye.

Hopefully during the flight today I can figure out what my next objectives are and begin to lay down a training plan.

Monday: October CTC – 10K Unrestricted

Sunday:  It was a lovely day down on the cape.  I did some maintenance around the house, including replacing some shingles that were blown off the roof by a wind storm and digging out some sand that built up around the basement entrance.  We hung out until late in the afternoon and I never got a chance to do a training session.  No great loss.

Monday:  Today is the 31st, so it was my last chance to post an entry for the October Cross Team Challenge.

screen-shot-2016-10-31-at-8-56-59-am

As usual during the OTW season, I go into these challenges not having a good idea about pacing.  My all time best 10K was in December of 2013.  I was in fantastic shape at that point and was knocking off most of my middle distance PBs.  Right now, my training has been focused on middle distance work for the head racing season, but I wasn’t sure how well that would translate to the erg.

I decided to try go out at a 1:52 pace and see how things went.

If you have been reading my training journal, you can probably suspect what a 1:52 target means in practice.  It means I went out around 1:50-1:51.

The way I do these middle distance pieces is to count strokes for each 1000m.  At the start, I was doing about 94 strokes per 1000m.  In this piece, I started to struggle a bit around 5000m and started to ease up on the pace.  The worst was at 2500m to go.  I saw a few 1:53s and 1:54s on the monitor.  I would push a bit, then ease up, then push again.  Once I got to 1500m left, I felt pretty sure I was going to make it, and I started to push harder and got 1:52s and 1:51s back on the screen.  With 500m to go, I started counting down strokes and rating up.

I am delighted with the result.  37:08.1, a 1:51.4 pace.  I ranked it on the C2 site and it’s 18th (97th percentile).  For the CTC results, I’m in at 77th place and the 4th place for Free Spirits.

I did a quick 1K warmup before and a 2k cool down after.

Tomorrow:  4 x 20′ L4