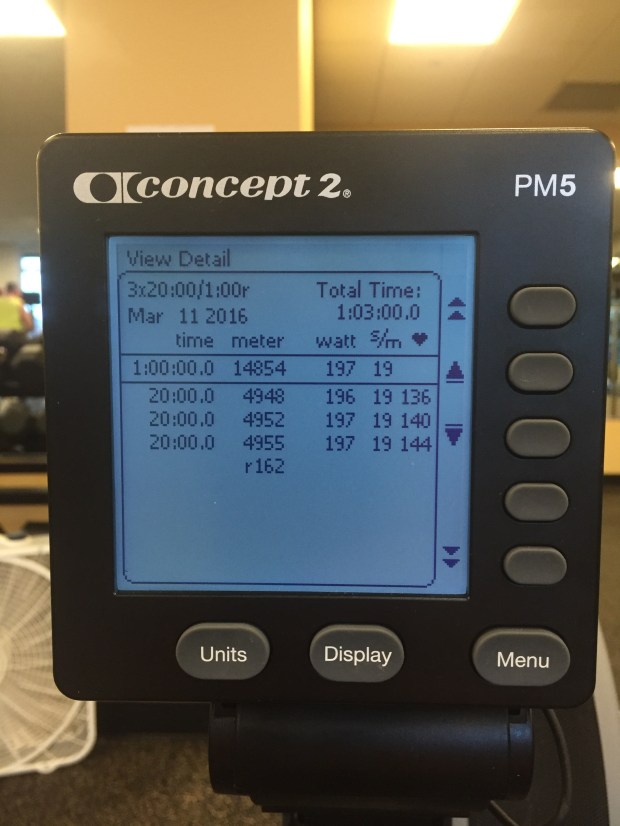
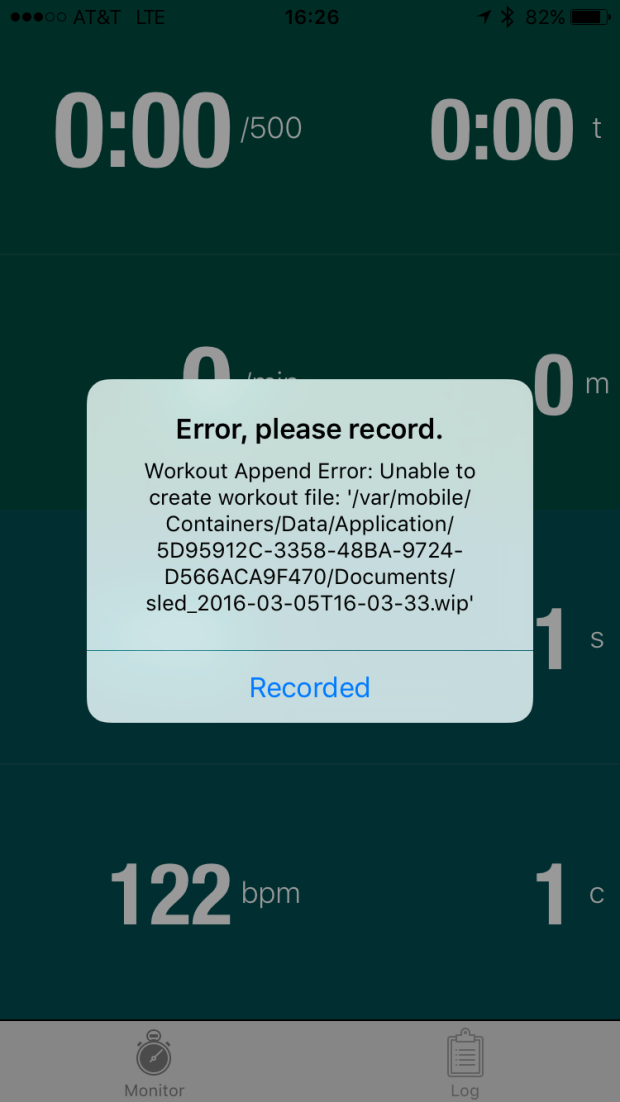
When I compared Ergstick and Ergdata last week, I wanted to also include Painsled (simple website here), but I is still in it’s beta test phase and was still working through a bug with the developer (Rick Terrell).
By the way, participating in the beta test process has been really positive. Rick has been very engaged and a steady stream of fixes have been included at a very rapid pace. The product is nearly done and totally useful in it’s current state.
Painsled is an interesting product concept. It is multiplatform (iOS, Chrome, Andriod), it works with PM5, PM4 and PM3. The PM3 and PM4 are supported using a usb cable connection, the PM5 via bluetooth). It provides TCX and CSV output options. Workout files can be exported from your phone via email, itunes, dropbox, or other iphone options. In the future, they are looking at export to fitness apps like strava, training peaks, concept2.
When you launch the app you get a simple dashboard, very much like ergdata, which mirrors the data on the PM5, but provides a few additional fields. I am hoping that some of the other parameters that get logged will become options for the dashboard in the future. But for my primary use mode, where I start up an app to log my data and then stuff my phone into a holster on my belt, I don’t much care what is going on with the screen.
The data output is TCX format, which I have successfully uploaded to Strava Or CSV. There are 2 different CSV file format options. One is a CSV event format which includes a record for every data update that comes from the PM5, so there are lots of records per stroke, maybe 10 or so. To be clear, this is not like the ergstick force curve data, but rather, and event for each stroke “state”. I played around with the file, but it is a ton of data and getting plots out of it outstripped my excel coding skills. In a recent release, they add the CSV stroke format. This concatenates all the data for each stroke into a single record and ships it out. This is very cool because that is exactly like the output from rowpro, and one of the ways that data comes out of a speedcoach. Adapting existing tools to use this data was a simple task.
One of the nice things about painsled is that it provides a richer set of data fields than ergdata. Here they are:
|
TimeStamp (sec) : Incomprehensible format, but increments in seconds through the whole workout across all reps and rests. A nice thing to have for graphs
|
|
activityIdx: Unknown
|
|
lapIdx : Increments for each interval
|
|
pointIdx : As far as I can tell the same data as stroke count
|
|
ElapsedTime (sec) : elapsed time for the current interval, resets to 0 at the start of each
|
|
Horizontal (meters) : distance within each interval, resets to zero.
|
|
Stroke500mPace (sec/500m) : standard pace seconds per 500 (ie 2:00.0 = 120s)
|
|
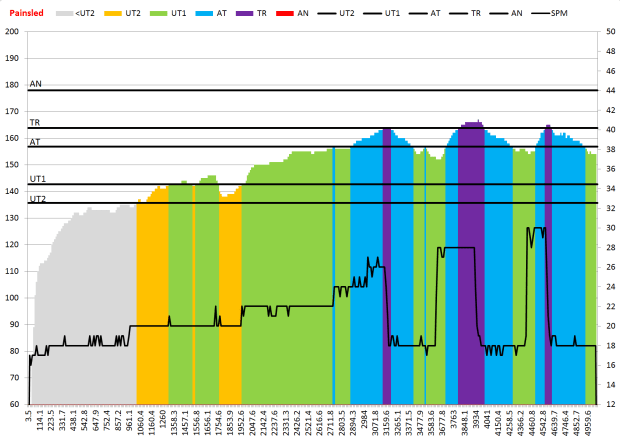
Cadence (stokes/min) : SPM
|
|
HRCur (bpm) : Heart rate
|
|
Power (watts) : stroke power, watts as displayed by the PM
|
|
Calories (kCal) : calories as displayed by the PM
|
|
Speed (m/sec) : self explanatory
|
|
StrokeCount : strokes with an interval
|
|
StrokeDistance (meters) : Yes, indeed directly logged DPS!
|
|
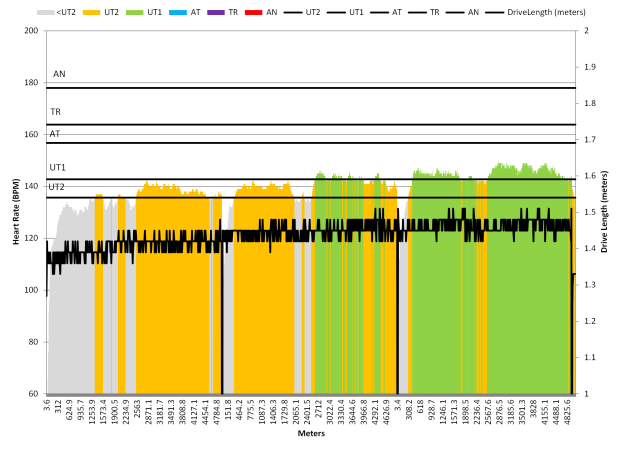
DriveLength (meters) : Another good bit of data that ergdata displays but does not log. painsled ships out for your pleasure.
|
|
DriveTime (ms) : How fast you pull!
|
|
StrokeRecoveryTime (ms) : How consistently you recover!
|
|
WorkPerStroke (joules) : Kinda like watts, but integrated into energy.
|
|
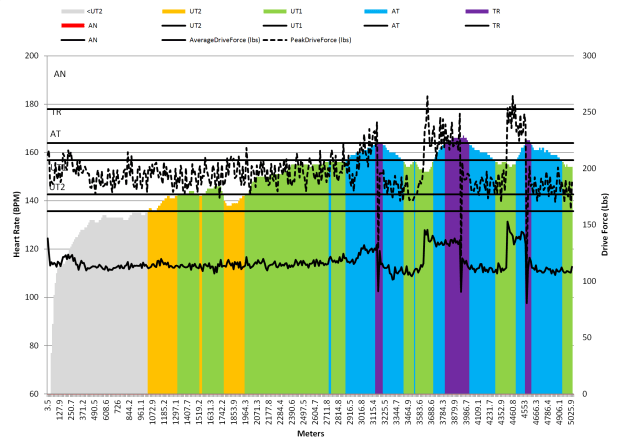
AverageDriveForce (lbs):
|
|
PeakDriveForce (lbs): I think this is cool, because it gives an idea of how consistent drive force across different rates
|
|
DragFactor: This is great because I never remember to look, and it’s good to have it logged.
|
My specific setup is as follows:
- Model C or D erg with PM5
- Wahoo Tikr HR belt connected to the PM5 via ANT+
- HR sensor also connected via BT-LE to my iphone and logging HR data in the wahoo fitness app (I know I’m obsessive, but it embarrasses me to admit that I do this in writing!)
- Also running on the iphone, either spotify, or stitcher, or another audio app.
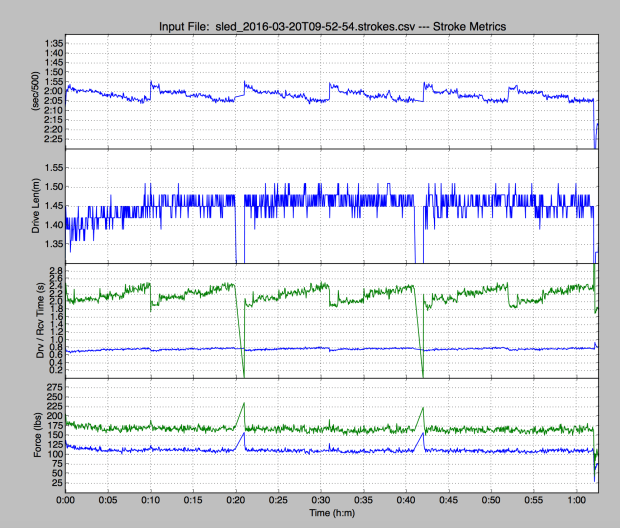
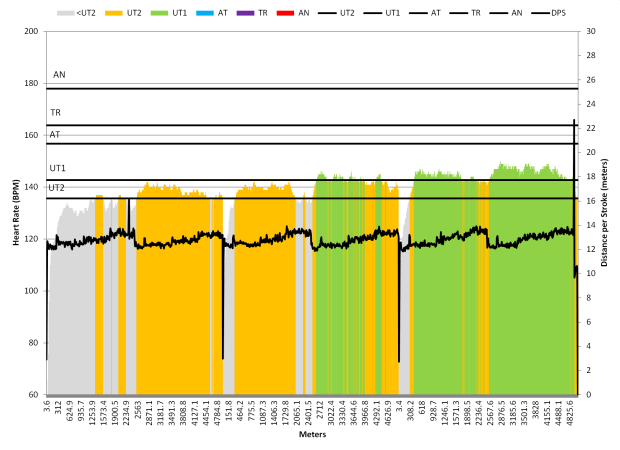
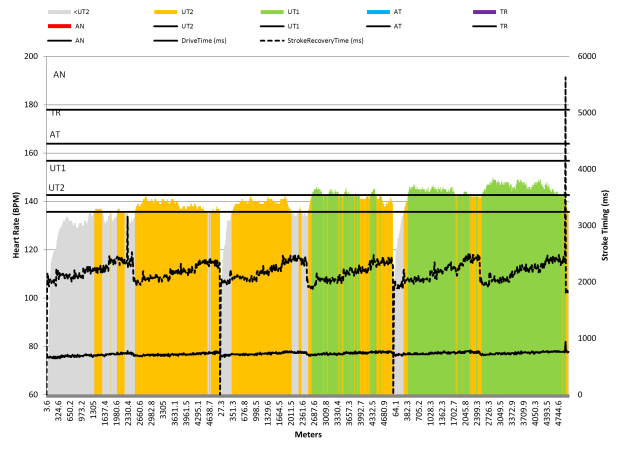
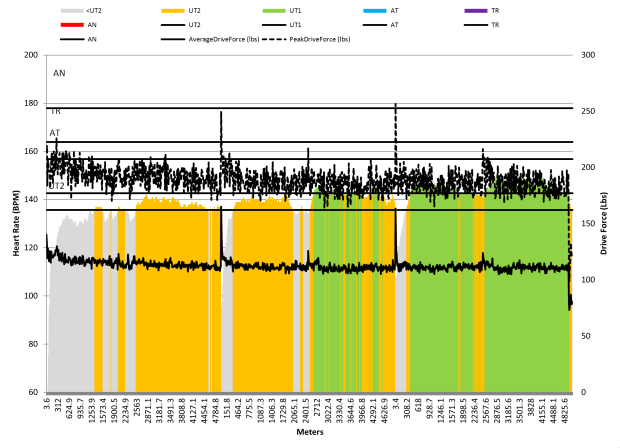
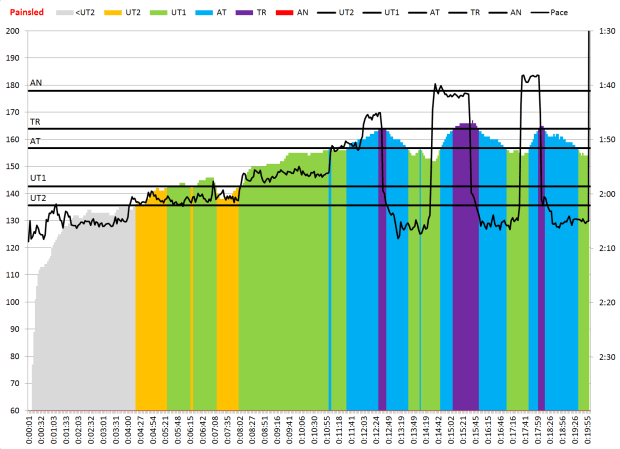
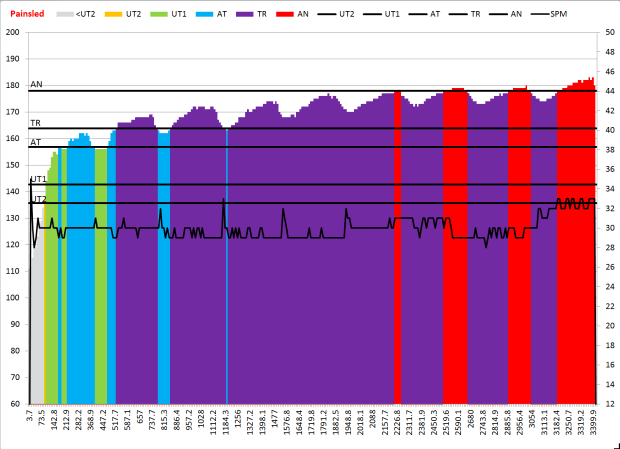
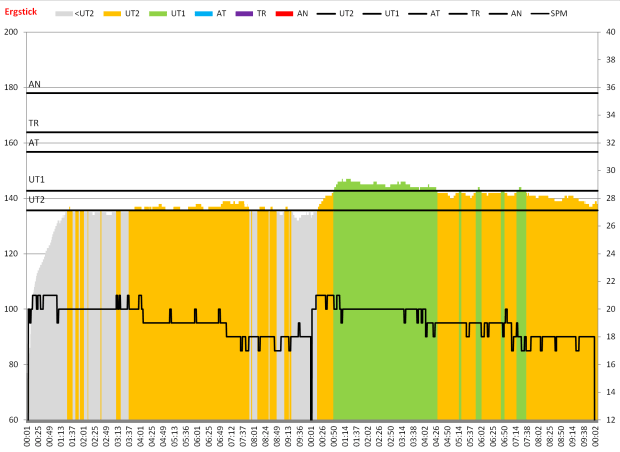
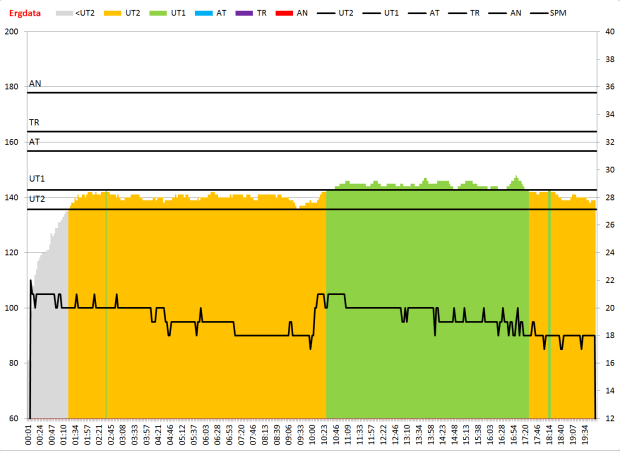
Today, I tried out painsled using this month’s cross team challenge. I also updated my excel workbook to process the CSV stroke output file. Here are the outputs for my warmup session today.
A couple of note son the graphs. I was happy to see that my drive time and drive force was pretty consistent from 18 to 22 SPM, and showed a proportional bump up for the higher rate, higher pressure parts of the warmup. I was also to happy to see that my drive length was staying consistent through all the rates and did not get shorter as my rate went up. So, yay for me!
The CSV file has the data to generate splits and tabular summaries, but I haven’t done that work yet. If anyone wants what I have now, drop me a line.
By the way, I am very happy with Painsled and recommend it to any data junkies out there. The only down side is the lack of direct integration with the Concept2 logbook. If that is added, then I think it matches all my needs!