
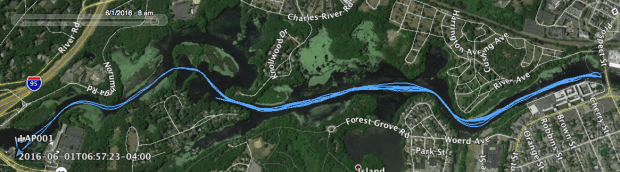
Gorgeous day. Mid 60s, dry, wind from the NNE 5mph with gusts to 10mph. This was a head wind going down river.
The plan was rate ladders. 4′ @ 18, 3′ @ 20, 2′ @ 22, 1′ @ 24. I planned to do single ladders and rest a minute or two and turn the boat around. This would take me from the start of the 2K stretch (including the s-turn) to the end of it. I was hoping to do 6 full ladders for a nice long workout.
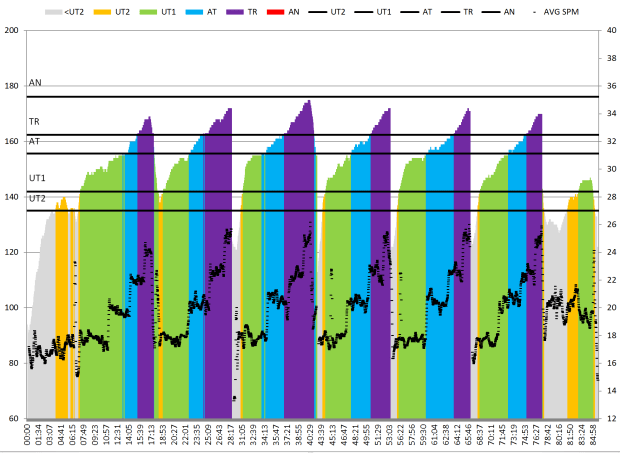
I did some square blade rowing from the dock out past the cut. And then started the first ladder. From the HR data, I am obviously pushing too hard at all the rates, but the paces were so depressingly slow, it was hard to lighten up and see the pace slow down past the 2:40 mark. I hope that I can blame this on the boat, or else, I’ve managed to lose about 5 to 10 seconds of pace from last season. If being on the water wasn’t such a treat, it could get depressing. But, as much as I could, I just focused on trying to take good strokes, get my blades off the water on recovery and keep the pressure on.
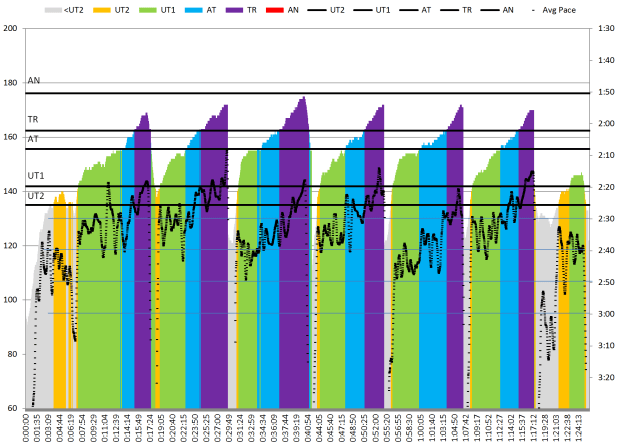
Back to excel plots today because the ones generated from the TCX data have ugly plateaus at the peak HRs when I stopped rowing for minute or so. The excel plots derived from the CSV data blank out data that doesn’t have strokes with it.
Now, I am it the airport heading to Chicago. I return to Boston Thursday night.
Tomorrow: Either a run or a fitness center biathlon.

This graph? http://rowsandall.com/rowers/graph/468/
Also, that’s a pretty strong wind which will have some impact.
LikeLike
Yep. The plateaus at the end of the later ladders is caused by me not taking paddle strokes during the rest. I think the TCX retains the last HR until another stroke occurs.
LikeLiked by 1 person
I may have a workaround for that plateau. I am setting the bar width to the time between measurements. I could give the bar width a maximum of 10 seconds.
LikeLike
Workaround implemented. Do pip install –upgrade rowingdata to update your desktop version.

Rowsandall.com is also up to date with the new version.
LikeLike