HR and Lactate – Workload effects and when to test.

I’ve been taking close to daily lactate readings for the past month and a half.  In addition to thoroughly perforating my ring finger and keeping Nova Pharmaceuticals in business, this has both baffled and entertained me as I tried to understand how to best implement a polarized training plan using lactate measurements to manage steady state intensity.

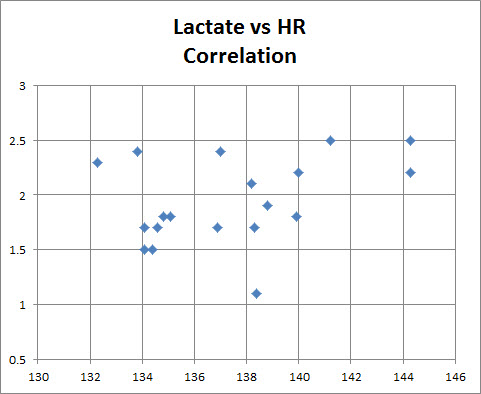
I’ve previously posted this scatter plot of lactate readings*2015-04-02_10-39-39

Which shows essentially no correlation between HR and lactate.  Over the past couple of weeks, I thought I was starting to see some relationship between lactate and HR readings and the day of the week, so it was time to bust out excel and see what i could find.

I follow a reasonably consistent workout schedule.

  • Sunday:  Usually rest, but last month I was doing 10K just to bank the meters for a C2 challenge.  Definitely the lightest trainning day in any case
  • Monday:  ~80′ of steady state at target training power
  • Tuesday: ~80′ of steady state at target training power
  • Wednesday: 20′ lactate test at target power, and then an intense interval session
  • Thursday: ~80′ of steady state at target training power
  • Friday: ~80′ of steady state at target training power
  • Saturday: 20′ lactate test at target power, then a middle distance threshold workout (10K,30min, 6K, 5K)

Another thing to note:  Saturday and Sunday sessions are at home on a static erg, during the week, most days are on slides.  The airflow and temperature at home are better too.

Here’s the HR and lactate data sliced by day of the week.

2015-04-02_10-48-09

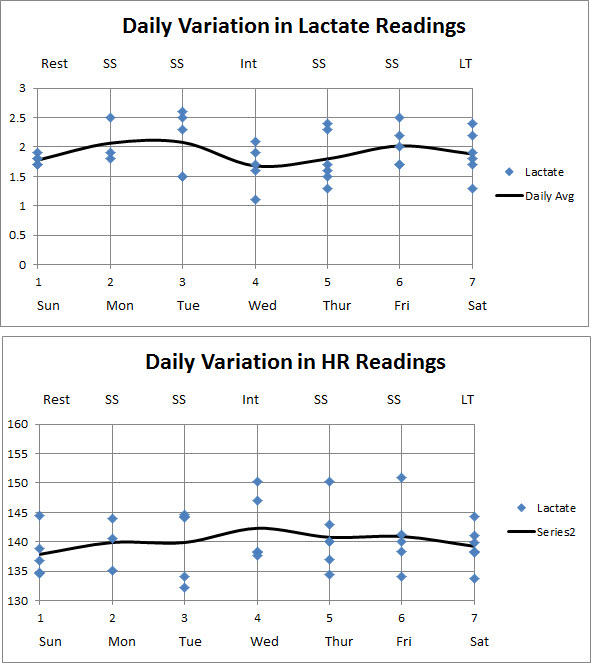
First things first.  Thee is still a lot of variation in the data when analyzed by day of the week.  But looking at the data for lactate you can see a repeatable variation by days of the week.  The effect is less pronounced with HR, but interestingly, it is shows a different day to day change.

So, starting with Sunday.  I am on a static erg, in a cool environment, in addition to that, I am coming off a hard workout the day before.  Both HR and lactate are low.  Average HR is reasonably consistent for Monday, Tuesday, Thursday and Friday.

So, what’s deal with Wednesday?  I theorize that by Wednesday my lactates are low and my HR is high because I of the accumulated workload on Monday and Tuesday, so I have less glycogen available to create lactate.  Since my Wednesday workout is shorter but more intense, it actually ends up being fewer overall meters (and calories) than a steady state session.  This means that I actually have more glycogen available on Thursday morning for steady state, so, lactates are up a bit.

It’s all quite confusing, but I think it makes sense to use a consistent. specific session during the week to set training power, and if you believe that the most important consideration for setting the optimal training power is to make sure that it consistently yields less than 2.0mmol/l in all sessions, that the session you use to test power setting should be one where you are well fueled and rested.  For me that’s Monday.

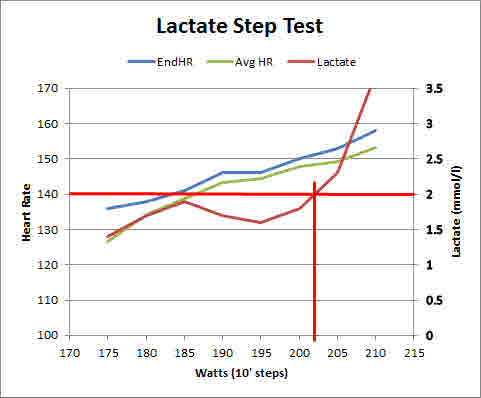
* Note: Lactate and heart rate readings are taken at the end of a 20′ steady state piece at constant power.  Lactate readings are taken at the conclusion of the piece.  HR is the average HR for the last 5 minutes of the piece.  Power is changed on a weekly basis (or sometime more frequently) to attempt to maintain lactate levels between 1.5 and 2.0 for all steady state rows.

Correlation between lactate and HR (hint: there isn’t much)

Many training plans use HR to determine training zones.  Other training plans use direct measurement of blood lactate levels to determine training zones.  Inevitably, there are questions about how well correlated these two measures are.  In other words, can you heart rate as an accurate indicator of blood lactate level.

To a first order, there is a rough correlation.  A step test will show a increasing lactate level and increasing heart rate as the steps increase in intensity, as shown below above 195W.

2014-11-28_17-22-32

The question is, can HR be accurately used  to determine a good training power to ensure that blood lactate is below 2.0mmol/l.  Over the past month or so, I’ve taken lactate readings after 20 minutes of steady state.  In all cases, I was aiming for a lactate level of 1.6 to 2.0mmol/l.  As you can see, I often miss on the high side, because I have trouble containing my exuberance.  The data shows very little correlation between HR and lactate level in this narrow range.

2015-03-16_11-20-24

Heart rate data is not entirely useless.  If the average HR over the last 5 minutes of the piece is above 140BPM, then it is very likely that blood lactate is above 2.0.  The problem is that a low HR is not necessarily indicative of low lactates, so if you train to a HR limit in a session you might end up with higher than ideal lactates in some of your sessions.  No real harm done, but you might not get the ideal training effect.

A more serious issue is that HR changes constantly through a steady state session as dehydration and other factors induce CV drift.  So training to a HR limit will generally cause a slow down as the session progresses.  If one is using HR as an analog for lactate, then you would probably want to use a HR limit that increases as the session continues.  For me, 140 after 20′, 145 after 40′, 150 after 60′ and 155 after 80′.  At the end that would be right at the top end of my UT1 range.  Ideally, a session would run about 5 beats lower than that at each point.

Rate prescribed workouts (Like Wolverine L4 workouts)

I’ve been thinking a bit about the relationship between rate and pace in steady state workouts. It started with a suggestion from Ben Redman that his target 2K pace was based on his steady state pace governed by the relationship

steady state power ( W ) = 2k power ( W ) * 55%

I had seen this before on the Rowing Illustrated boards and it was generally paired with the guideline that one should row steady state at 18 SPM to try to make sure that power per stroke was roughly the same as race pace work.

This made me go back and dust off the old Wolverine Plan pace charts. These give specific paces for r16 up to r26 based upon your 2K test pace.  Here is an excerpt.

2015-02-12_6-20-03

When I looked at them, I couldn’t make sense of how there were derived.

They are not based on linear increase in pace with stroke rate, nor an linear increase in power, nor are they constant SPI, nor are they constant distance per stroke. They are closest to constant SPI, but start at a high SPI, decrease a bit in the middle and then increase markedly as you get up to r24 and r26.  Here are the splits, watts and SPI for a reference pace of 1:43.

2015-02-12_6-24-18

An alternative to the L4 paces that are included in the wolverine plan are to use a constant “Work Per Stroke”, or “SPI”.  to derive training pace or power for different rates.  One example of this is a model posted on the BioRow website.  There is a spreadsheet for erg training paces that allows you to plug in the intended race rate and then provides paces for stroke rates higher and lower than that rate for different 2K times.  Basically, the model calculates the SPI for your race pace and rate and then maintains that SPI for different rates.

Another, different approach to constraining rate and pace is “S10MPS”.  This stands for “Strapless 10 Meters per Stroke”, and I think it was promoted as an approach by Paul Smith (His website is here).  A number of very good ergers use this approach which constrains your efforts to try to hit exactly 10 meters per stroke, indendent of stroke rate.  This naturally constrains the pace.  Here’s what that looks like from a wattage, pace and power perspective.

2015-02-12_7-43-55

Having looked at the workouts that Paul recommends for his clients, they seem to be constrained to a relatively narrow range of paces from 2:00 to 1:45, which translates to rates between 25 and 30.  I have also drawn the conclusion, but I’m not sure if it is true that S10MPS is a training technique, and then for time trials, and races and some high intensity interval sessions, you strap in and row to pace, without regard to maintaining 10 meters per stroke.  The thing I find interesting about this is that it does really hammer home the idea of maintaining stroke power as you increase rate.  You can see this with the SPI going way up as the paces get faster.

Anyway, having looked at all of this stuff, I have settled on using the simple idea of using linear increases of power with increasing stroke rate.  I am using the 55% of 2K power formula to come up with a reasonable power level for 18SPM and increasing 10 watts for every 1 spm increase.  This is not far off of the L4 levels and the same as the Biorow eWPS approach,  It’s also handy because it’s easy to remember a 10 watt change for each rate.  Here’s are my current targets.

2015-02-12_7-54-17

These are reasonable powers levels for rowing on a static erg.  For rowing on slides, where it is quite uncomfortable to row at low rates, I find that I need to shft this whole table by 2SPM.  So, I target 160W for r18, 180W for r20, and so on.

If anyone wants to play with the spreadsheet, here it is:L4 variations